This article was published in Scientific American’s former blog network and reflects the views of the author, not necessarily those of Scientific American
Editor’s Note: The following is a guest post from data visualization engineer and data analyst Zan Armstrong.
As humans, our lives are filled with routines, habits and schedules. There are times that we wake up, go to school or work, or to the gym. We have routines around coffee breaks, rush hour traffic, meetings and soccer games.
Yet, there are some things that break our routines. Many families have a story of the baby that was born minutes after Dad’s heroic drive to the hospital, speeding across town in the middle of the night; or the sister or brother who almost died but for a last-minute C-section that saved their life; or the friend who labored for 27 painful hours before the little one finally came out.
On supporting science journalism
If you're enjoying this article, consider supporting our award-winning journalism by subscribing. By purchasing a subscription you are helping to ensure the future of impactful stories about the discoveries and ideas shaping our world today.
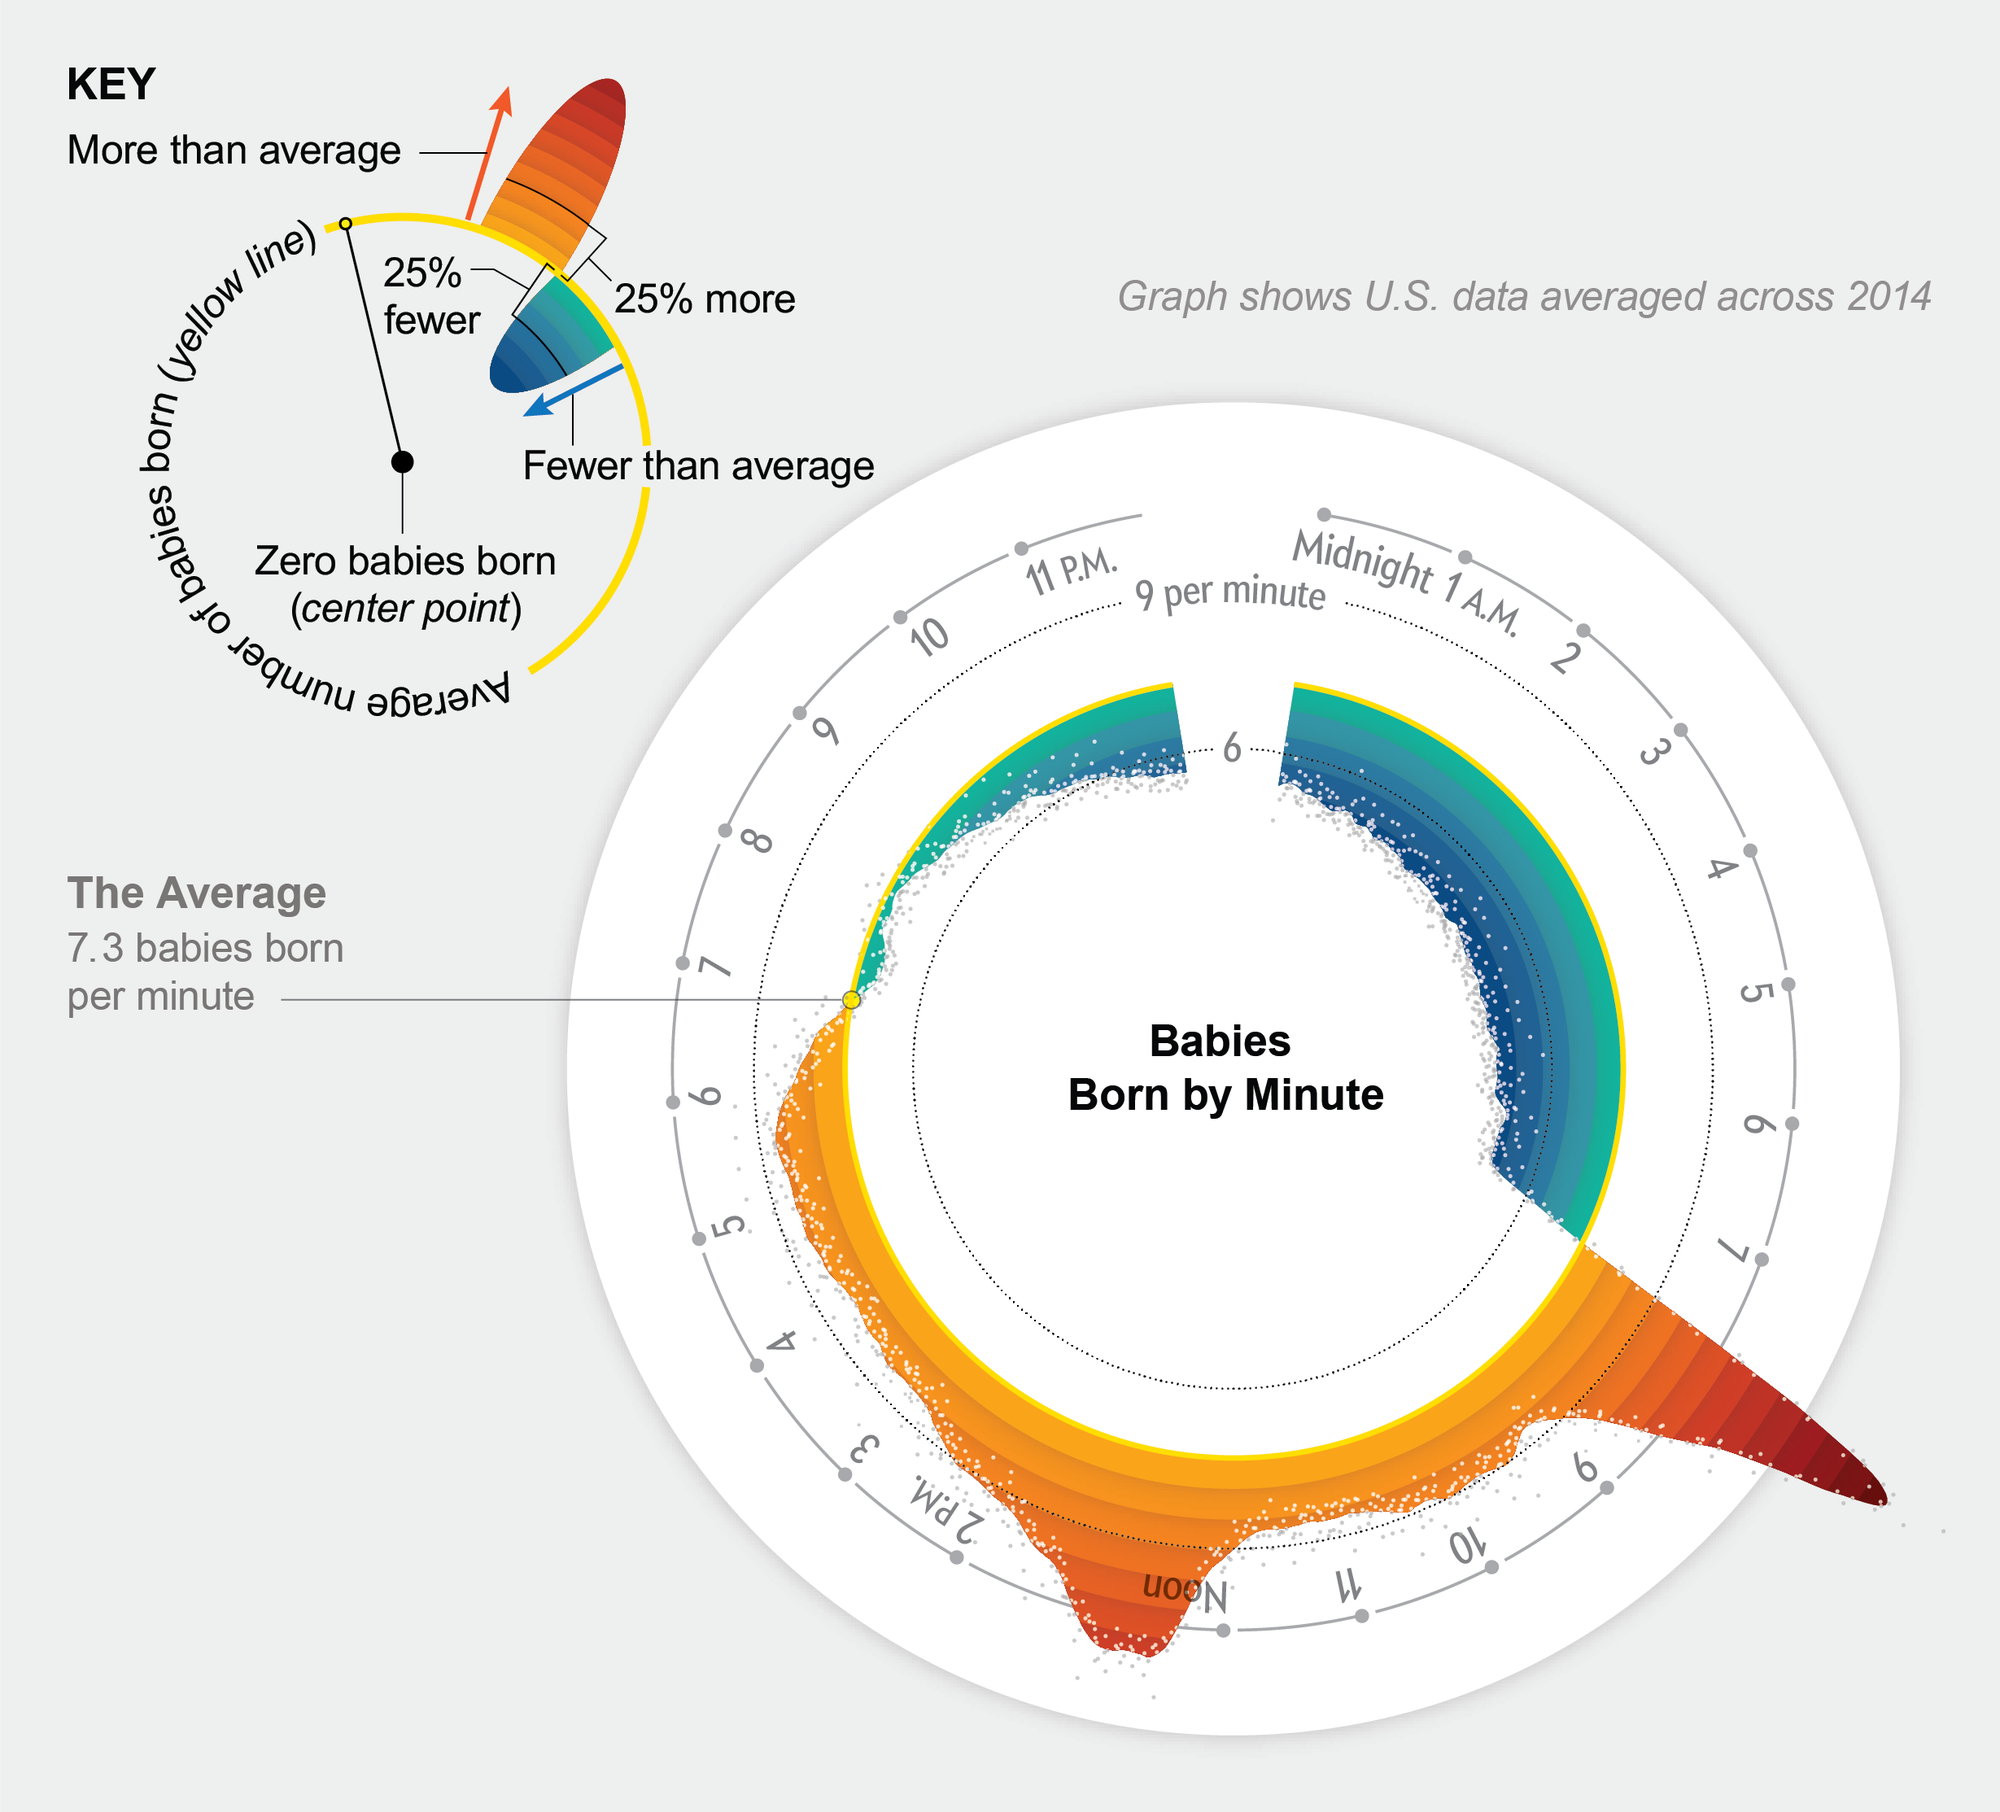
Based on the stories we share, it would be easy to imagine that when a baby is born is random. In the U.S., however, weeks in September have 5 to 10 percent more births than weeks in January. Twelve thousand babies are born on a typical Tuesday compared with 8,000 on a typical Saturday. Sixty percent of babies are born during the day, between 6 A.M. and 6 P.M. And, 3.5 times as many babies are born at exactly 8:00 A.M., the most common minute to be born, than at the least common, 3:09 A.M.
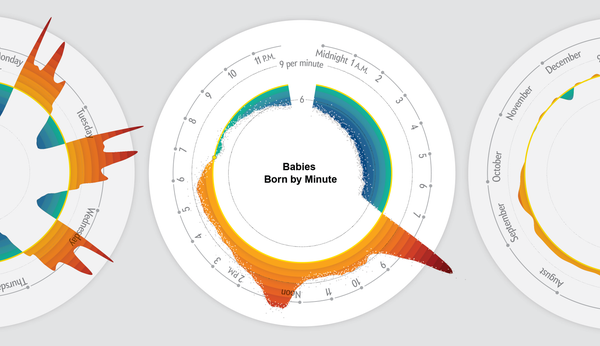
The graphic below (developed by Nadieh Bremer and me for the July 2017 Scientific American) reveals these regular birth patterns. It shows what minutes of the day, hours of the week and weeks of the year are more common or less common than average.

Credit: Nadieh Bremer and Zan Armstrong; SOURCE: FiveThirtyEight, from data supplied by U.S. Social Security Administration (week data); Centers for Disease Control and Prevention (minute and hour data)
There is a rhythm at each time scale. However, the intensity of this rhythm is much higher at the more granular time scales.
For example, only 20 percent more babies are born in the most popular week than the least popular. In contrast, the most common hour of the week to be born has 3.3 times as many births than the least. Each weekday morning there is a big spike around 8 A.M.
Why? Where do these repeating patterns come from? Why is there so much difference in the numbers of babies born during some times of the day than others?
How a baby is born affects when a baby is born
In the U.S., 32 percent of births are C-section surgeries, another 18 percent are the result of induced labors and 50 percent are “natural” (vaginal deliveries without induction). If we break down the data by the method of delivery, we see a distinct rhythm for each type of delivery method. Together, these three intersecting patterns create the overall minute-per-day pattern we see: fewer births at night, a huge spike in the morning and a broader afternoon bump.

Credit: Nadieh Bremer and Zan Armstrong; SOURCE: Centers for Disease Control and Prevention
For the 50 percent of babies born without intervention, we see a night/day pattern. Roughly 20 to 30 percent more babies are born per minute between 6:45 A.M. and 6 P.M. than during the night.
Inductions also show a two-part pattern each day. There are fewer peak hours, from just 1 to 6 P.M., however. The difference is larger, too, with 220 percent more babies born per minute during the peak hours than the lightest hour between 6 and 7 A.M. Medically, there is a long and variable lag between when a baby’s birth is induced and when the baby is actually born. So, medical professionals may time the induction in the hope that the baby will be born during the workday when there is more staff on hand.
The C-section pattern looks entirely different. There is a huge spike first thing in the morning, another bump just before noon and a plateau in the early evening before the drop at night. There are very few C-section births at night. Roughly 10 times as many babies are born per minute during the early morning peak than the middle of the night. Whereas some C-sections are performed due to an emergency during birth, most are scheduled for varied reasons. Therefore, when a C-section takes place is heavily influenced by hospital schedules and the workweek, as is true for any other planned medical procedure.
These three delivery methods have different daily patterns, because different factors influence their timing: a natural process; a delay after labor is induced; or a scheduled surgery. Together these three patterns combine to create the patterns we see in aggregate during the day.
Credit: Nadieh Bremer and Zan Armstrong; SOURCE: Centers for Disease Control and Prevention
For example, the hour with the most births per week, 8 to 9 A.M. on Mondays, is mostly driven by C-sections. C-sections are up by 3.7 times average whereas natural births are just above average and inductions actually slightly less common than average during that hour. In total, births are up by 1.9 times compared with average.
In the early afternoons, from 2 to 3 P.M. on weekdays, the overall rate is up to 1.4 times the average rate. During this hour all types of deliveries are elevated: C-sections are 1.4 times the average; induction is twice average; and birth without intervention is 1.2 times the average. All three delivery methods are also less common at night than during the day, although the difference is biggest for inductions and C-sections.
In summary, when we look at the number of babies born by minute, and not just by day or week, we discover sharp daily spikes and a shallower dip at night. We can't help but wonder, why? What causes these spikes and dips? Disaggregating the births reveals that each delivery method has a distinct daily pattern. And, furthermore, we can now see how these three distinct patterns combine to create the overall minute-per-day pattern. This leads to seeing a more general relationship between when babies are born and how they are born. Drilling down doesn't just illuminate the details, but suggests a new way of seeing the big picture as well.
Editor’s Note: Data is for babies born in the U.S. in 2014, as reported by the CDC. If you’re interested in learning more about repeating seasonality patterns in data, check out the talk, Everything Is Seasonal, which inspired this project.