This article was published in Scientific American’s former blog network and reflects the views of the author, not necessarily those of Scientific American
Brain Index creative direction by Mark Hansen and Laura Kurgan.
Credit: Jen Christiansen (photograph of installation)
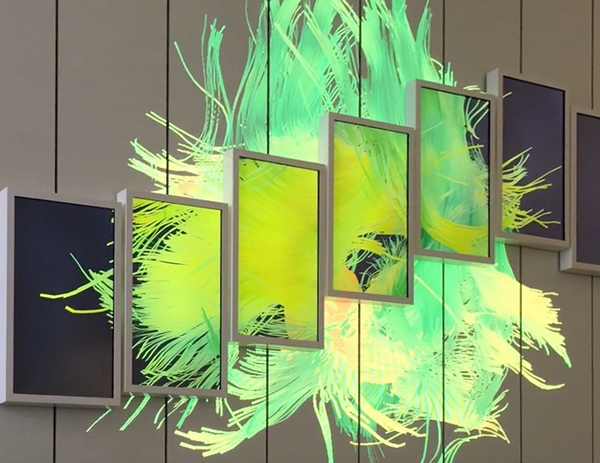
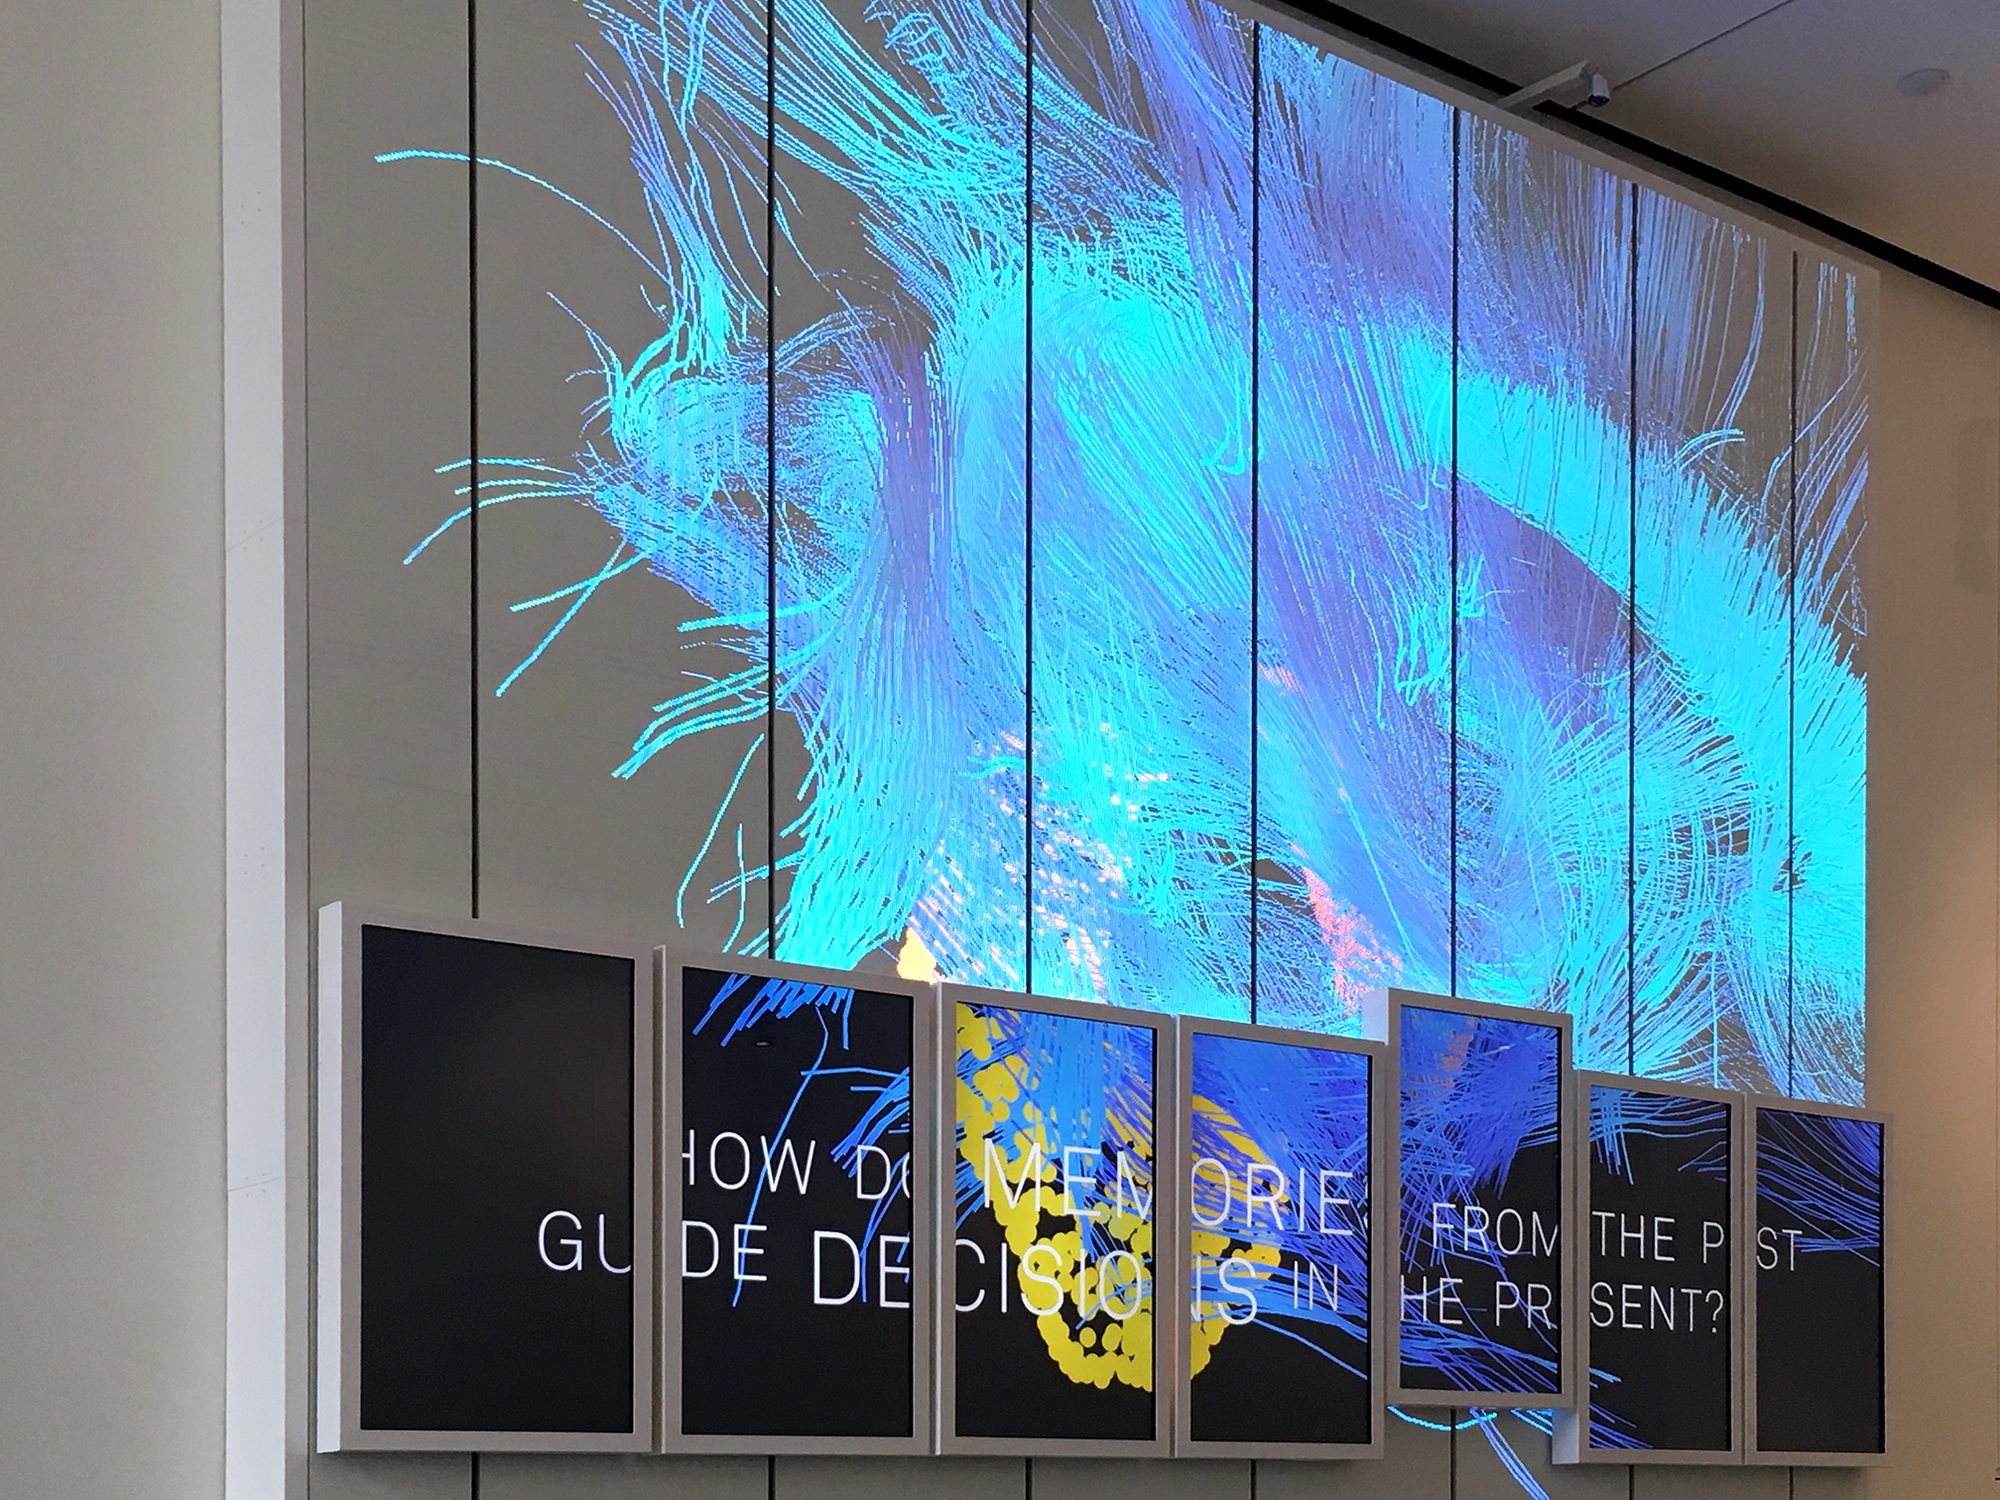
A lot of human connectome images (neural connection brain maps) pass across my desk as reference material for Scientific American graphics. But I’ve never seen it like this: Twenty-four feet tall, rendered with a LED system and seven 72 inch monitors that crawl up and down the wall. The connectome rotates and transitions into a view of the external surface of the brain. The monitors slide up, focusing the viewer’s attention on a strip of the background image, revealing that portion in greater resolution. Then the monitors cascade back down to human-level, and beckon people to step forward and interact.
Brain Index creative direction by Mark Hansen and Laura Kurgan.
Credit: Jen Christiansen (time lapse video of installation)
On supporting science journalism
If you're enjoying this article, consider supporting our award-winning journalism by subscribing. By purchasing a subscription you are helping to ensure the future of impactful stories about the discoveries and ideas shaping our world today.
I’m at the Jerome L. Greene Science Center on Columbia University’s Manhattanville campus, checking out the new Brain Index exhibit. The project aims to capture the imagination of visitors with larger-than-life imagery and interactive stories about research conducted in the labs upstairs. Commissioned by the Mortimer B. Zuckerman Mind Brain Behavior Institute and orchestrated by creative directors Mark Hansen (Professor of Journalism, Director of the Brown Institute for Media Innovation) and Laura Kurgan (Associate Professor of Architecture, Director of the Center for Spatial Research), it’s now a permanent feature of the ground floor, and open to the public.
Brain Index creative direction by Mark Hansen and Laura Kurgan.
Credit: Jen Christiansen (photograph of installation)
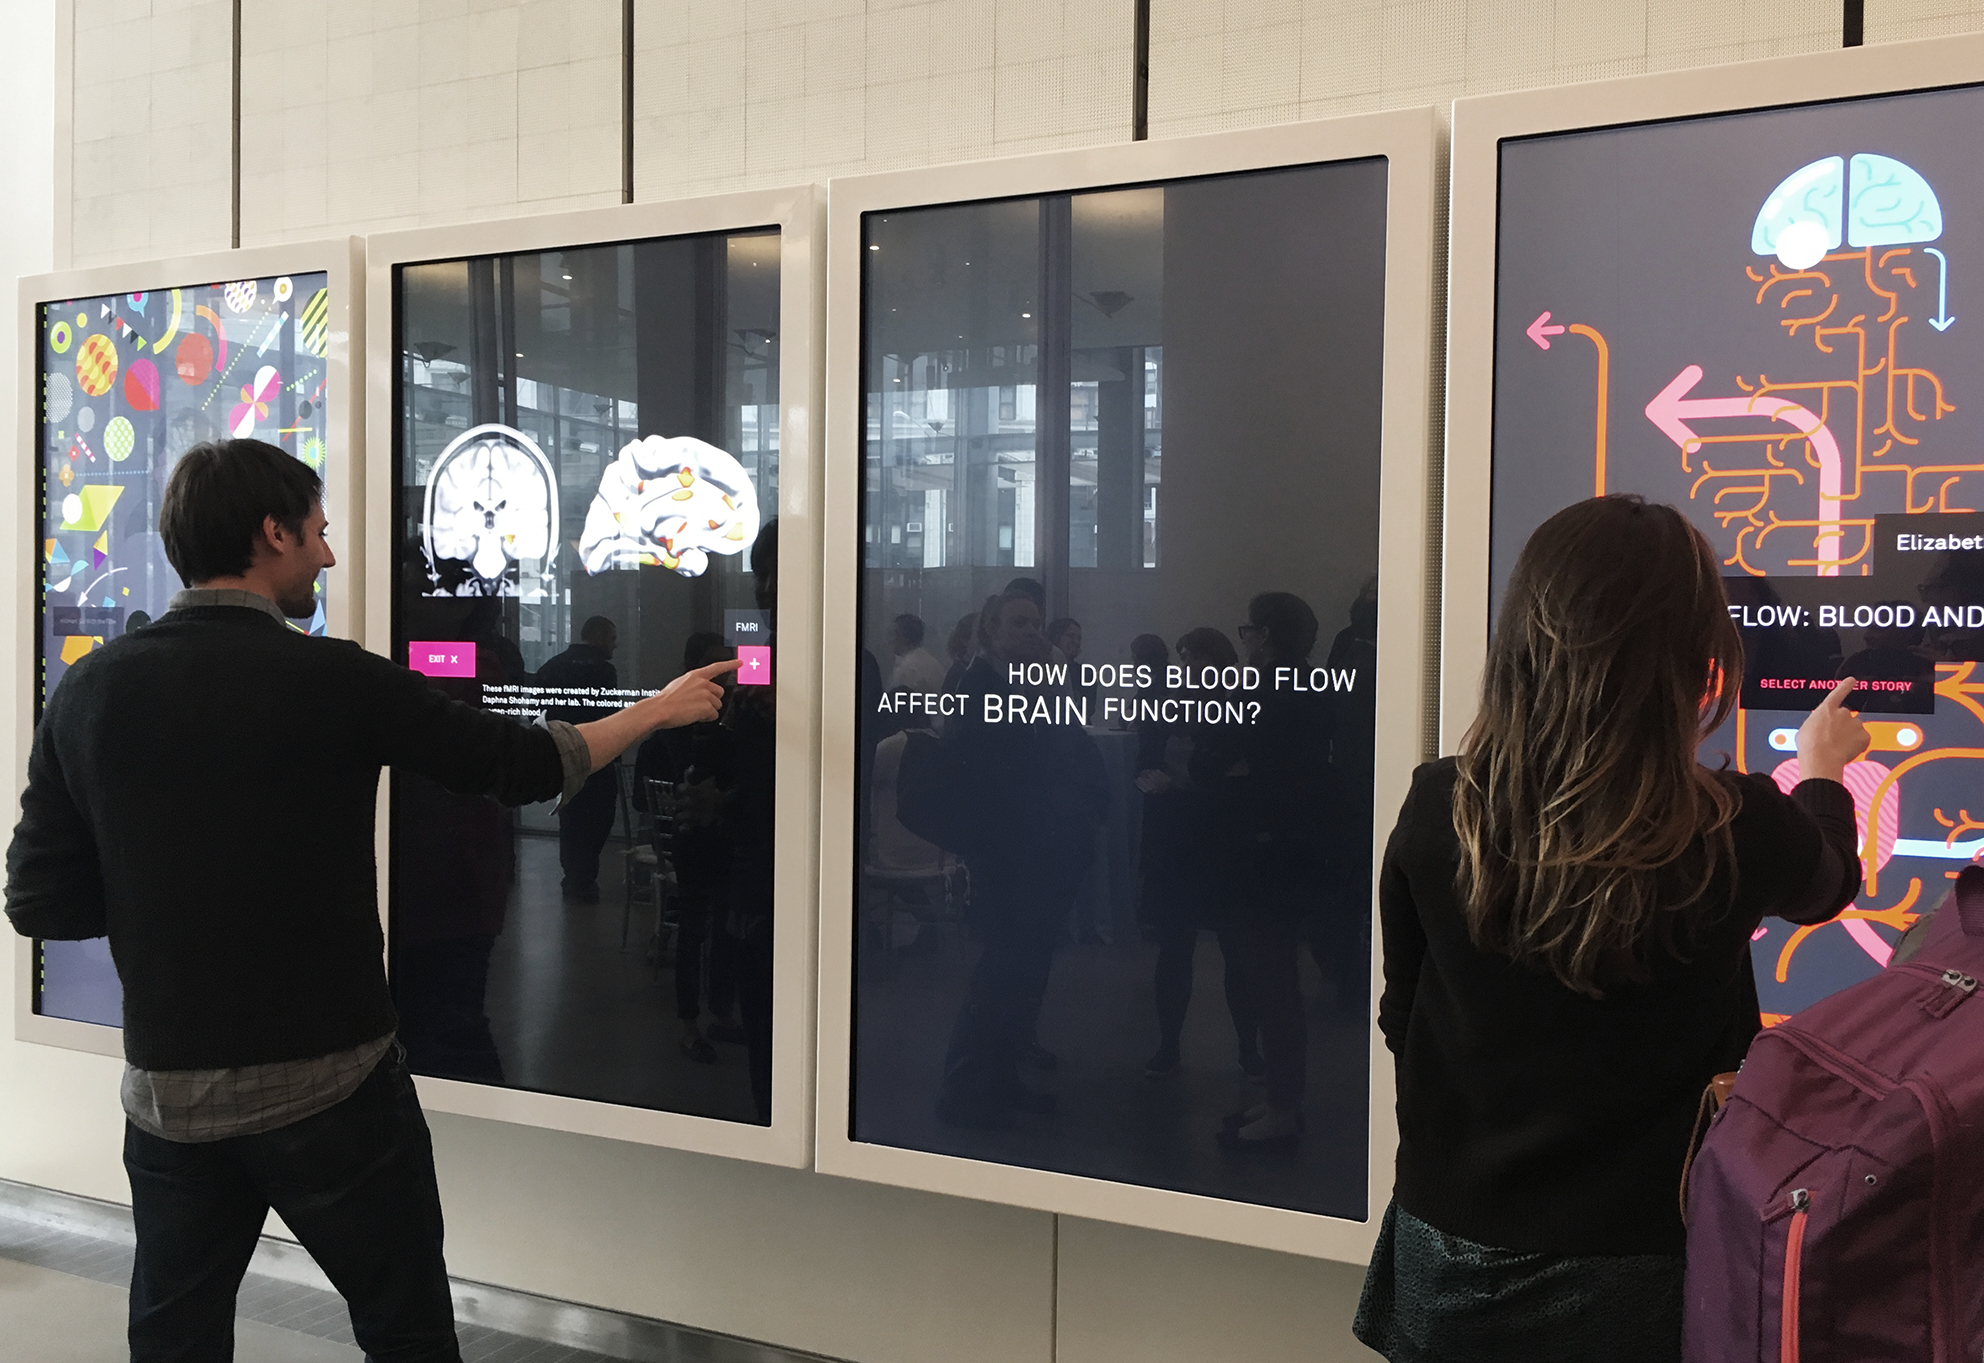
Eight scientists are featured when the touch-screen monitors dock at ground level, allowing visitors to swipe their way through an overview of their research, woven together with illustrations by Fernando Togni. A panel on blood and the brain catches my attention, highlighting Elizabeth Hillman’s work. (See her article in Scientific American MIND on the neuron-blood vessel connection, and how things can go wrong with it). Although the blurbs are interesting, after perusing a few stories, I find myself wanting the screens to crawl back up the wall. I spend too much time with my nose close to a screen as it is. There’s something refreshing and thought-provoking about stepping back, looking up, and watching the brain dance.