This article was published in Scientific American’s former blog network and reflects the views of the author, not necessarily those of Scientific American
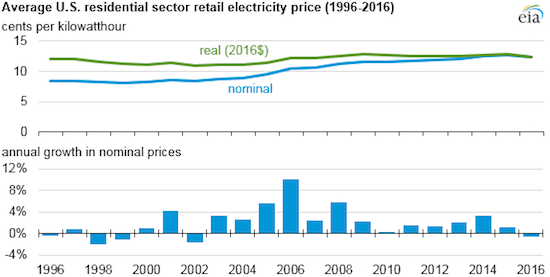
The latest data from the U.S. Energy Information Administration (EIA) show that during the first six months of 2016 American residential customers paid 0.7 percent less for electricity than they did in the same period of 2015. While this decline might sound modest, it represents the first time residential electricity prices have declined at all since 2002.

What’s behind the surprising decline in retail electricity prices? It has to do with the combined forces of cheap natural gas and more renewable energy. To understand exactly how these forces are pushing down retail electricity prices, let’s dive in to how the wholesale market price of electricity is established through the scheduling of power plants.
On supporting science journalism
If you're enjoying this article, consider supporting our award-winning journalism by subscribing. By purchasing a subscription you are helping to ensure the future of impactful stories about the discoveries and ideas shaping our world today.
The grid operator schedules electricity generation by sorting all available generators according to their “merit order,” or marginal production cost in dollars per megawatt-hour of electric energy. The least expensive generators are turned on first and more expensive generators are only turned on as necessary as electric demand increases. The wholesale market price of electricity is equal to the cost of producing one additional unit of electric energy at any given time. Thus, the market price is equal to the production cost in dollars per megawatt-hour of the most expensive generator currently scheduled by the grid operator, because this is the generator that still has extra capacity available to produce electricity if called upon.
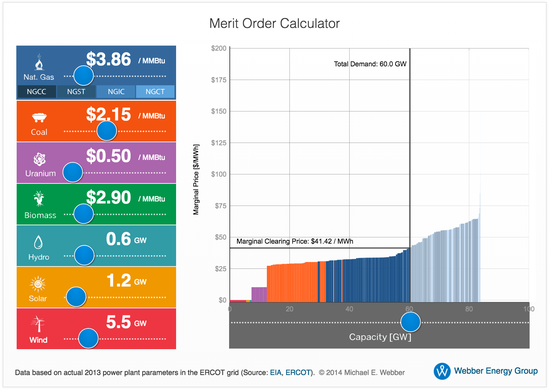
This explanation might be confusing, but hopefully the figure below simplifies things a little bit. It illustrates the merit order of generators on the Texas grid in 2013 using real generator capacity and average fuel price data. Individual generators are sorted in ascending order by their marginal production cost. The height of each bar is the production cost and the width of each bar is the capacity of the generator. The price of electricity is determined by where the current level of demand (illustrated by the vertical line) intersects the merit-order supply curve: $41.42 per megawatt-hour or 4.1 cents per kilowatt-hour for the demand and fuel prices illustrated below.

The market price of electricity is determined by the intersection between the level of electric demand (vertical line) and the price of electric supply (stacked bars). To see how changing the price of fuel, the amount of renewable generation, and the level of demand affects the electricity price, click the chart to access an interactive version. (Source: Webber Energy Group)
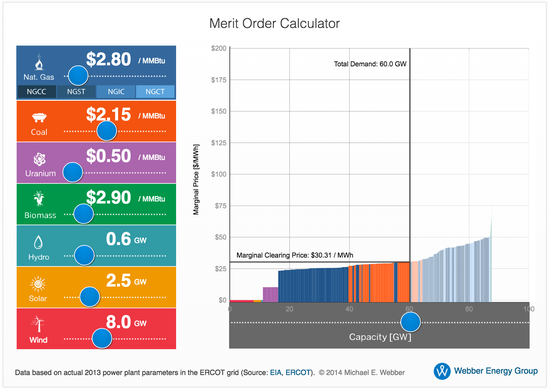
What happens if the natural gas price or the level of renewable generation changes? Click on the chart above to open an interactive version and find out. Because natural gas generators are the most expensive in the merit-order supply curve, reducing the price of natural gas sharply reduces the price of electricity. Likewise, increasing the amount of renewable generation available shifts the whole supply curve to the right, causing the price of electricity to reduce further. For the low natural gas price, high renewables case I entered into the calculator below, the price is just $30 per megawatt-hour, or 3 cents per kilowatt hour — over 24 percent less than the price illustrated above.

Reducing the natural gas price and increasing the amount of wind and solar generation decreases the electricity price. (Source: Webber Energy Group)
The dynamic illustrated by tweaking the inputs to the merit order calculator is exactly what’s pushing down the average residential price of electricity in the United States. More renewables and cheaper natural gas equals lower market electricity prices — which usually leads to cheaper prices for consumers.
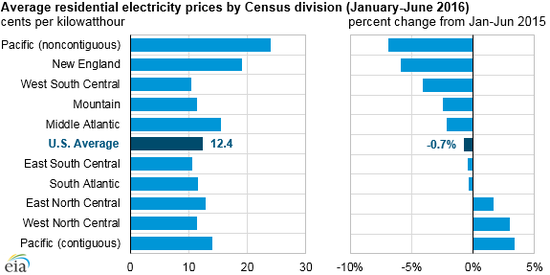
But not all U.S. consumers saw lower electricity prices in early 2016. Prices actually increased for residents of the contiguous pacific states (California, Oregon, Washington) and the Midwest (East North Central, West North Central).

Despite falling generation costs, the price of electricity increased in some regions due to increasing electric delivery costs. (Source: U.S. Energy Information Administration)
The residential price of electricity increased in these states due to increasing electric delivery costs, which are separate from the generation costs explained above. According to EIA, utilities in these states sought permission to increase their rates to cover the cost of electricity transmission lines and natural gas pipelines (that feed those new cheap natural gas plants!). So residential prices actually increased even though the market price of electricity generation declined due to low natural gas prices and higher renewable penetration.
The fact that prices didn't decrease for everyone is a useful reminder that the price we pay for electricity doesn't just cover the cost of generators, but also all of the wires, poles, transformers, control centers, and utility employees that make sure electricity flows reliably from power plants to our homes. In my view, it's incredible that electricity costs just 10-15 cents per kilowatt-hour when you consider all of the equipment and employees required to produce and deliver electric power.
Agenda image credit: NASA
