This article was published in Scientific American’s former blog network and reflects the views of the author, not necessarily those of Scientific American

In July I presented at the 50th anniversary conference of the Guild of Natural Science Illustrators (GNSI). Here’s a lightly-edited transcript of that talk, with an abridged set of companion images.
***
Thanks for including me in the annual meeting. Particularly this year, here in Washington, DC. Although I’ve been a bit of an absentee family member, this feels something like a homecoming, in that the first GNSI meeting I attended was also in Washington DC, 22 years ago.
On supporting science journalism
If you're enjoying this article, consider supporting our award-winning journalism by subscribing. By purchasing a subscription you are helping to ensure the future of impactful stories about the discoveries and ideas shaping our world today.
.jpg?w=1350)
With the goal of reinforcing connections between communities and to strengthen some of those family ties, I plan to use this time to prompt you to think about what you [scientific illustrators] can learn from—and teach to—a few different sub-disciplines within the broader orb of visual science communication. For example: Where does the illustrator end….

….and the infographer begin?
.jpg?w=1350)
How does data visualization fit in?

And what does science have to say about the design decisions we make?

But first, I should provide some context. The thoughts to follow are very much rooted my own experiences. This is a bit of a reflection upon what I’ve observed over the last 20 years as an art director. This is not a comprehensive literature review or a rigorous look at the entire field of science visualization. These are musings related to my journey—rooted in the world of publishing—with shout-outs to some of the resources and communities that I’ve found helpful or thought-provoking along the way. I am inevitably going to get myself into some trouble, as I’m not a specialist in all of the sub-disciplines that I’ll be speaking about. But I do work at the intersection of these sub-disciplines, and over time I have developed a set of resources that may be of interest to you.

As background, for context on what has shaped my point of view, I should say that I self define as a graphics editor, science communicator, and an infographer. I was trained primarily in traditional (or physical) media. Here’s one of my first published scientific illustrations—ink drawings of hydrothermal vent shrimp mouthparts. It’s one of the products of a few summers in college, working in a crustacea lab at the Natural History Museum of Los Angeles.

But I did get a chance to dabble in the digital realm starting in the late 1980's with a Commodore Amiga, thanks to my high school art teacher, Robert Tartter. I then shifted over to tablets and virtual drawing at Smith College, where my instructor Gary Niswonger led exercises like blind contour figure drawing. Model in the middle of the room, our backs towards our monitors, and Wacom tablets in our laps.
As much as I loved my art and design courses, I also loved my courses in science. I resisted choosing one discipline at the expense of the other, and pursued a double major in geology and studio art. Then, a scientific illustration graduate program at the University of California, Santa Cruz (now hosted by California State University at Monterey Bay) caught my eye, and allowed me to officially merge the two disciplines under the tutelage of Ann Caudle, Jenny Keller, and Larry Lavendal. Instead of dedicating myself to a single scientific line of research, I’d help make other people’s research accessible to wider audiences through a visual language.
I entered the publishing scene after graduate school, as an intern in the art department at Scientific American, thanks to my mentor, Ed Bell. This is my first illustration for the magazine; a watercolor cockroach.

My internship turned into a full-time job, and as my role shifted from artist to art director, I found myself setting my watercolors and Rapidograph pens aside and turning to the computer as my primary tool. In 1998, I left Scientific American to work as an assistant art director, then a designer, at National Geographic. All the while, growing as an art director, and learning about print production from some of the best in the business. Five years later, I left DC and established a freelance science communication business, focusing mainly on magazine and book projects.
In 2007, I returned to Scientific American, where I’m now the senior graphics editor. Today, there are two of us on the graphics team, Amanda Montañez and me. We art direct all of the information graphics in the magazine, from data visualizations (like the sample on the left by Pitch Interactive), to illustrated explainers (like the sample on the right, by Cherie Sinnen). Occasionally we develop the final images ourselves, but most often we hire freelance artists, and manage the project.

We also manage digital versions of all the graphics for web and phone viewing, and Amanda develops graphics specifically for the web environment…

…but I’m going to remain rooted in print examples for what I’ll be sharing today.
Editorial illustrations, like these examples by Maria Corte Maidagan and Jay Bendt, are art directed by other folks in the art department (design director Michael Mrak and art director Jason Mischka).

.jpg?w=1350)
What’s the difference? By my definition, information graphics are illustrations, built on a foundation of research, that exist primarily to convey information. Whereas editorial illustrations are thematic illustrations that are inspired by the text, and which entice readers to engage more fully with the magazine’s content.

For example, for an article on the microbiome, illustrator Bryan Christie developed an opening image that is not a literal representation of the concept, but instead nods to the idea of a human as being defined by the microbes within. Bryan is telling a story with visual symbols and thoughtful composition. This is not an information graphic. Instead, it’s a metaphorical illustration that nods to the theme of the text.

Within the article, Bryan and his collaborator Joe Lertola shift into information-graphic mode, using visual symbols and thoughtful composition to convey very specific information that is rooted in research. This is not an editorial illustration. It’s an information graphic or explanatory diagram.

Some artists, like Bryan Christie, are comfortable in both of these worlds.

But this is where I reside, when it comes to my own illustration work and in my role as a graphics editor.

That said, I can learn from, and often work with, artists who navigate both sides. For example, for an article on malaria vaccines, I built out the content plan and composition, shown here.

But knew that it would take an adept artist to breathe life into the spread. So I hired the illustration team of Peter and Maria Hoey to develop the final rendering. Peter and Maria have a great way with icons and develop rich textures and depth in their editorial work, attributes that served this information graphic well.

Similarly, I leaned heavily on editorial illustrator Leandro Castelao’s styling and color palette to make this schematic of interferometers feel like it belongs in a consumer magazine, and not a scientific journal…

…and Gavin Potenza’s style provided a fresh look at a topic that lots of media outlets covered, giving us a stylistically distinctive timeline of Mars exploration.
.jpg?w=1350)
When working on my own illustrations, I find that I sometimes get hyper-focused on details related to accuracy, and the illustration style can fall flat. Things can get very academic looking and anonymous really fast. Editorial illustrators like Jillian Ditner and Chad Hagen remind me that injecting the artist’s voice and point of view and sense of style is OK, particularly in the context of a magazine.

Let’s revisit this slide…

…and dive in further to some lessons learned and specific resources related to information graphics.

I tend to think of information graphics as a continuum, with figurative representations at one end and abstract representations on the other.

In the world of science visualization, you could argue that the full continuum can also be referred to as data visualizations.

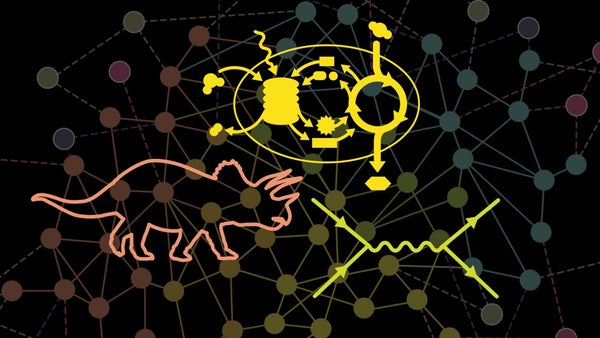
After all, essentially all of our work is rooted in data collection at some stage in the process: from bone length measurements in dinosaur reconstructions, …

…to meticulously documented laboratory experiments that build up to a more complete understanding of processes like photosynthesis …

…to representations of mathematical expressions, like Feynman diagrams…

…to straight-up plotting of the raw data itself, in chart form.

But, outside of the world of science visualization, it may be more useful to think of the continuum like this:

When I flip through old issues of Scientific American, it strikes me that many artists worked across this full spectrum. Regular contributor Bunji Tagawa’s body of work astounds me. Here’s a small sample, to give you a glimpse at the breadth of his skillset. It ranges from figurative depictions of objects…

…to medical cutaways…

…technical schematics…

…and data visualizations. [For more, see “Remembering Bunji Tagawa” by Amanda Montañez].

But as a graphics editor at the magazine now, I find myself maintaining discrete freelance pools for each of the different points along the continuum.

Perhaps this is an artifact of my own biases, but when I flip through old issues of Scientific American, it occurs to me that this increased specialization may also be in part due to the shifting tools of each of these areas. When the primary tool for developing representative illustrations, explanatory diagram, and data visualizations for print magazines was pen and ink, an artist could become a master at pen and ink, then explore different methods of problem solving in each of these areas. Here are more examples from Tagawa. Again, from organics…
.jpg?w=1350)
...to technical cutaways…

…abstract representations of processes…

…and number-based plots. All in pen and ink.

As desktop publishing became ubiquitous and digital rendering tools diversified and became more widely available, it seems to me that the simple act of choosing a primary tool starts to define the edges of the artist’s scope. As an art director, I find myself specifically looking for 3D artists to build physical objects, like this example by Don Foley.

And I look for artists like Tami Tolpa, who hone in on composition and the flow of information by iterating with tools like Adobe Illustrator for explanatory diagrams.

And data designers that build solutions with code for visualizing large datasets, like Jan Willem Tulp.

Each of these tools, mediums, styles and genres take lots of time to master, and tend to favor certain portions of the continuum.

Many of the conferences I attend and communities that I engage with seem to reinforce these divisions, by focusing on the tools. And it seems that artists that span more than one of these orbs are harder and harder to find.

Perhaps that way of thinking about things is a bit overly dramatic. The reality is probably much more like this.

And perhaps this is a completely natural and fine state to be in—particularly since the primary tools for these different sub-disciplines have bifurcated over time. And perhaps there isn’t value in trying to force discrete clusters to reconnect.
After all, some of my favorite recent Scientific American graphics are the result of bringing together different artists—plucking experts from each of those groups and matching them up to create a final image that draws upon all of their strengths, not forcing one artist to excel in all areas. For example, I love to take an artist who can develop spot illustrations with a stylus or pen, and pair them up with an artist who can custom code data visualization solutions, as in this example by Moritz Stefaner and Jillian Walters.

But it also applies to graphics like these, in which different pieces of the full story are simply better served by different types of visualizations and areas of artist expertise.

That said, I argue that even if you don’t have the desire to work across the full continuum—or the time to dedicate to becoming proficient across the full continuum—there is lots to be learned from each of these clusters, and I’d love to see more cross pollination of ideas between them. I think we’d all benefit, if things looked more like this:

And even better, if things looked like this:

I’m not arguing that everyone along this continuum should learn how to code. Or that everyone along the continuum should build clay maquettes and paint from life. I’m arguing that we can—and should—learn how science visualizers from cross the full spectrum think through and solve problems.
In that spirit, I’d like to share some of the things that I’ve learned from individuals within these different clusters.
First, I should note that at this web address: http://bit.ly/jenGNSI, you’ll find a Google Sheet of more complete citations and links to sources that directly relate to the rest of my presentation. I’ll be showing some examples from the magazine that exemplify the lessons that I’ve learned, but in many cases, I’ve absorbed those lessons through a variety of books, blog posts, presentations, podcasts and workshops. This Google Sheet will guide you to specific references that you might find inspiring as more context for each of the following points.
And at this web address: http://bit.ly/SciVizResources, you’ll find a more general list of references that I’ve built in response to specific requests from students, scientists, and artists interested in learning more about scientific visualization—all the way from illustration to data visualization—as well as references related to the work I do as a science graphics editor.
Back to representative illustrations. Here are 5 key lessons that I’ve gleaned largely from the scientific illustration community.

Lesson number 1: Every detail is worthy of intense attention and care. Every feature should be observed and considered.

For a graphic about the impact of mosquitoes on public health, artist Immy Smith demonstrates that yes, a lineup of different mosquito species can, in fact, be visually interesting and informative…

…and reinforces the idea that different mosquito species are connected to different diseases in humans. Some of my colleagues were a bit skeptical at this plan—they worried that the mosquitos would all look the same. But the careful and exacting eye of artist Immy Smith revealed the variations between them.

It’s clear here that every pencil mark is intentional and considered. To my mind, the thoughtful and meticulous rendering of every single detail is a challenge to the reader to, in return, carefully and thoughtfully consider each insect depicted.
Lesson 2: Get your eyes on the subject matter

For an article on the American burying beetle, artist Kelly Murphy knew she’d need to render the insect from a variety of angles. Existing images online made for great references for top-down views. But in order to get a better look at the mouthparts and in order to more accurately represent the beetle in different positions, she tracked down a specimen at the California Academy of Sciences and spent some time photographing it from all angles.

Lesson 3: if you can’t get your eyes on the subject matter, consider making an approximation.

Artist James Gurney’s scenes are incredibly convincing in part due to the dimensional models he develops to inform his composition and lighting.

Lesson 4: There is power in photorealistic and hyper-real renderings

As Ed bell wrote in 2010, “Artist Ron Miller takes us on a journey to eight of the most breathtaking views that await intrepid explorers of our solar system. The scale of these natural wonders dwarfs anything Earth has to offer. What might we see and feel if we could travel to these distant domains? The artist’s eye—interpreting data from probes such as NASA’s Cassini, which is now exploring the Saturnian system, and MESSENGER, which has flown by Mercury three times and goes into permanent orbit next March—allows us an early visit to these unforgettable locales.”

Lesson 5: There is power in non-photorealistic renderings

Here, artist Carol Donner edits out non-essential details and employs transparency to create an aesthetically appealing and clear look at the heart. Unlike Ron Miller’s objective in the view of Saturn, the goal here is not to help the reader to experience an environment. The goal here is to represent the behavior of an object.

As Ian Suk and his co-authors wrote in The Journal of Biocommunication, “Medical illustration, by its very essence, requires some degree of simplification and idealization of the subject. It is the role of the illustrator to visually educate the reader regarding a complex biomedical procedure, structure, or process in an aesthetic and efficient manner.”
Let’s start to slide over more into the realm of information graphics and explanatory diagrams.

Lesson 1: There’s power in knowing when and how to distort the physical form of your subject to best serve the informational content

This particular example was rendered by Bunji Tagawa. It’s a variation on a classic schematic representation of the cardiovascular system. Rather than get caught up in the details of a human figure, the information is streamlined in a way that highlights the closed and circular flow of blood through the system.

Lesson 2: Composition is key: the artist should be acutely aware of how they are guiding the reader’s eye through an illustration

Here, John Grimwade very intentionally guides the reader's eye through the page with spare linework, selective color, and setting up the flow of action in a way that reinforces the flow of information.

Lesson 3: Text is vital. It is just as important as images.

Here, artist Emily Cooper presents an elegant set of four Atlantic Ocean views. Labels help orient the reader to a certain degree, and you can piece together parts of the story: We’re looking at how winds and the gulf stream relate to temperature. But it’s hard to sort out what the take-home message is.

That’s where text comes in. The headline and annotation subheads immediately provide context.

The graphic aims to explain why winter is warmer in Europe, according to four different models. Through that lens, the reader is now primed to compare and contrast the four models.

Lesson 4: Welcoming gestures, in the form of relatable details or moments of joy, can engage readers

Nigel Holmes is an expert at including touches of humor and humanity to explanatory graphics. Here, he manages to inject life into a graphic about group theory and the mathematical underpinnings of symmetry. But the figures aren’t simply decorative. They help reinforce the concept of the cube rotation around different axes.

Lesson 5: Context is key. Your audience and the goal of the information graphic should guide both content and style.

For an article on artificial photosynthesis, a scientist provided us with the reference material on the left. It’s a schematic of the device they had developed to mimic the process. The image is perfectly serviceable for the scientist’s peers, and for the context of a scientific paper. But for a consumer magazine, we needed to not only engage non-specialist readers, but also help them more immediately see the parallels between this technology and natural photosynthesis. Our version is on the right. Note that we introduced a photosynthesis primer of sorts for basic context. And the context of a consumer magazine granted us the freedom to go a bit more playful with the rendering style, making it a great match for botanical artist Cherie Sinnen.

Let’s continue sliding over more into the realm of abstract renderings and data visualization.

Lesson 1: Fully explore your dataset. Then explore it some more.

For a graphic about changing bee populations over time, data visualizer Moritz Stefaner started by exploring the raw data, in forms ranging from bar charts to tables and heat maps to network diagrams, all in the service of examining the shape of the data through many different lenses. The data sketches on the left are just a small sample of the total. Only after he had thoroughly examined the data in different forms did he start to hone in on what final form might serve the data—and our readers—the best.

Lesson 2: It’s OK to embrace complexity

But when presenting people with a complicated, layered, and rich look at a topic, always provide the reader the tools they need to interpret the visualization. Here, for an article on the evolution of mythical stories, the design studio Accurat presents many levels of data in a single visual. It’s a complicated and rich data visualization, rooted in a complicated and rich dataset from a scientist. Some folks might argue that we’re requiring too much effort on behalf of the reader. There’s not a quick way to read this.

However, we set things up with a clear “How to Read this Figure” key, using informal language that you might use when talking a friend through the graphic. The idea being that once the reader dedicates a bit of guided effort into learning how to read things, they can then pop over and see a few annotated main takeaway points, then explore further on their own. This type of approach also allowed us to present the full dataset, rather than distilling things down into an over-simplistic summary.

Lesson 3: Novel forms can draw a reader in

For a piece on when babies are born, data scientist Zan Armstrong and visualizer Nadieh Bremer collaborated to develop this custom solution for the magazine. The information here could be presented in a more classic and linear chart form as well. But I doubt it would’ve captured the readers’ attention nearly as well. The circles are not only captivating, but they also reinforce the cyclical nature of the data, like a clock. As with the complex example, however, the reader should be given a clear guide on how to read the graphic.

Lesson 4: But sometimes a straightforward line graph or bar chart is best
.jpg?w=1350)
For this chart nugget on bias in coronary artery disease research, there was no need to push the boundaries or try to be clever. A straightforward and simple and familiar chart form was all that was needed.

Lesson 5: Your source data is not objective. Nor is it complete.

I’ve included links to some great resources about this in my main reference list, but I think it’s worth nodding directly to a few specific writings here.
As researcher, artist and software developer Catherine D’Ignazio writes in her post “What would feminist data visualization look like?”
“What’s the issue? Feminist standpoint theory would say that the issue is that all knowledge is socially situated and that the perspectives of oppressed groups including women, minorities and others are systematically excluded from ‘general’ knowledge…

…Until we acknowledge and recognize that power of inclusion and exclusion, and develop some visual language for it, we must acknowledge data visualization as one more powerful and flawed tool of oppression.”

And on the topic of missing data, artist and researcher Mimi Onuoha writes, “Datasets are the end product of classification systems, the clean outputs of intentional orderings. Datasets point to their own contrasts—specifically the things that we haven’t collected…

…And if it is true that we make sense of the world through exclusion, then perhaps there is a special type of meaning to be found in the things that we leave out.”

These ideas have made me approach some projects with both more trepidation and clearer vision. For an article on infectious diseases, we hoped to give folks a sense of the global state of things. How have infectious diseases impacted public health over time and space?

Art researcher Amanda Hobbs was a huge help on this front, doing a large literature survey and identifying some of the known pitfalls. We ended up using pretty standard and authoritative sources for the bulk of the spread: The Centers for Disease Control and Prevention, and the World Health Organization.
But even seemingly well-meaning authoritative sources can’t control for data collection variations over time and space. And data collection methodologies are developed by individuals with inherent biases. So, I made sure to read the data documentation carefully, avoiding known pitfalls and making note of when methodologies changed. That helped guide decisions like the time interval we used, as well as some on-chart annotations. And we ran things by a few experts in the field for a reality check.
I’m still thinking that we should have done more to help readers understand that this sort of data is far from perfect. In the future, I plan to fight a little harder to keep more explanatory text intact. But we at least left a pretty clear crumb trail with the source citation, so that it’s possible for people to inspect the original data for themselves.
And now, four bonus lessons from across and around the continuum.

Lesson 1: Question design “rules”

Many of us can probably recite oft-quoted “rules” from well-known authors, like Edward Tufte’s proclamation that “Graphical excellence is that which gives to the viewer the greatest number of ideas in the shortest time with the least ink in the smallest space.” But how do we know that’s true? And if it is true in one context, is it true in another? Perception scientists are steadily chipping away at some of these sorts of questions.
I’d encourage you to check out the Datastories podcast for interviews with some of those researchers, Robert Kosara’s blog Eagereyes for leads on where else to look, and Kennedy Elliot’s post entitled “39 studies about human perception in 30 minutes.”

Lesson 2: Share

I am often struck by how generous the data journalism community is when it comes to sharing visualization best-practices, story ideas, techniques, tools and resources. If you’re interested in learning more, a great place to start is the Computer Assisted Reporting program of the Investigative Reporters and Editors organization.

A few more specific resources include Jennifer LaFleur’s guide to bulletproofing your data…

….and ProPublica’s “The Nerd Blog.”

Lesson 3: Create spaces for dialogue

The intersection of science and the fine and performing arts is a bit further outside of my personal wheelhouse, but I’m excited to continue to learn more about how artists and performers engage with broad audiences in different kinds of spaces. And I’m interested trying to figure out how to apply those lessons of engagement within my magazine work.
For more, I’d encourage you to check out SciArt Center, an online platform and event organization that promotes cross-disciplinary collaborations, art exhibits and events.

And for more information about the performing arts and science, see Jamé McCray’s talk at the SciVizNYC conference in 2017, as well as one of the communities she references in that talk, SuperHero Clubhouse. As I mentioned a moment ago, I’m trying to figure out how to apply some of their lessons of audience engagement and dialogue within my magazine work.

But meanwhile, I’m trying to actively create spaces for dialogue for the science visualization community as a member of the organizing team of SciVizNYC. I’d love to see this model put into action in other locations.

The idea for this event rolled out of conversations with medical illustrator Jill Gregory. She and I enjoyed visiting each other’s workplace, to see how we each put our training in scientific illustration to use. We wondered if a roving meet-up event could work, in which a group moved from one office to another studio to another newsroom over the course of a day, seeing how different folks put scientific visualization to use in their daily work. As the idea grew, Jill and I were joined by co-organizers Christopher Smith, Amanda Montañez, and Ni-ka Ford. We ended up moving forward with a more traditional—and logistically easier—all-day event in a single location featuring 14 speakers. Our first event, in 2016, was free. We charged $35 a seat for our second event to discourage no-shows. But it was important for us to keep the cost of entry as low as possible, while still paying our speakers a small honorarium for their time. Thanks to funding from the Icahn School of Medicine at Mount Sinai, we were able to make that happen. Our event brings together a wide variety of visual science communicators together—primarily from the New York City area—to learn about the topic from many different angles.
Which brings me to Lesson 4: We’re stronger together

I’d like to tip my hat to platforms and communities that encourage idea and tool sharing. I’ve grown a great deal by seeing the data visualization community problem solve in real time on Twitter, watching panel discussions about technology and interaction through the lens of ethics at Eyeo Festival, listening to talks about the open web at OpenVisConf, learning about how visual journalists from around the world solve problems at the Malofiej World infographics Summit,….the list is too long to call them all out individually here, but I’ve included some of my favorites in my general resource list.

There’s certainly already evidence of lesson crossover between communities. For example, the idea of using annotations in information graphics has infiltrated the data visualization world, as demonstrated by tools developed in 2017 by data visualization engineer Susie Lu. Her work facilitates annotation integration for charts built with code.

And you could argue that the photo-real versus non-photo-real dynamic in scientific illustration, is mirrored by the complex versus simple dynamic in data visualization.

But I think we still have so much to learn from each other, especially when it comes to the challenge of visualizing scientific uncertainty—a communications challenge that cuts across all areas of science, and thus, all areas of science visualization.

At the magazine, we often work with academics and research scientists. Communities that regularly fall back on conventions like error bars. And all too often, I faithfully reproduce those error bars (shown here in gray), figuring that adding a few labels might be enough to unpack meaning.

The same goes for confidence intervals, like these. I’m not convinced that I did enough here to really help the reader fully understand what they’re looking at.

A few years ago, I had a pivotal conversation with a cartographer at a Gordon Research Conference for visualization in science and education. Diana Sinton (from Cornell University) caused me to step back, and think about how I depict uncertainty more critically. We kicked off a collaboration, with support by a mini grant funded by NASA that resulted in this poster presentation, in the hopes of adding another perspective to the broader conversation on visualizing uncertainty.

At the time, conversations with regards to uncertainty tended to swirl around climate projections, but more recently, I think it's fair to say that election forecasting has taken center stage.
We started by diving into the literature, and that got me wondering, in data visualization, do we lean too heavily on conventions like the whisker box plot, error bars, and violin plots? And are conversations about which of these approaches are better than others too circular in nature?

What if we borrowed from qualitative, rather than quantitative examples? At Scientific American, we deal with representing different types of uncertainty all the time across different disciplines in explanatory diagrams. Can we borrow from those, and apply to data visualization?

What if data visualizers took inspiration from scientific illustrators? And scientific illustrators took inspiration from data visualizers? Maybe we could work together to figure out more intuitive ways to represent statistical uncertainty.
Quantum mechanics, and Heisenberg's uncertainty principle seems like a great place to start. Specifically, the idea that “events at the atomic level cannot be observed with certainty.” It’s worth underscoring that the uncertainty principle describes quantum behavior and uncertainty at the particle level. And isn’t a perfect analogy for uncertainty at the macro or classical physics level.

But I’m more concerned with how we *illustrate* the uncertainty associated with the idea. So I think that studying figures like this one, which depict quantum mechanics, can still be really useful beyond the quantum world.

I don’t want to get too bogged down in the science behind many of these examples, and truth be told, I only have a fleeting grasp on some of the physics they represent. But I still think that they can be informative, and hopefully inspiring. On the left, the classical view of light as a combination of oscillating electric and magnetic fields. On the right, light as viewed through the lens of quantum mechanics—in which that line fluctuates within a larger envelope of uncertainty (shaded region).

The level of uncertainty not only varies over space, but also varies over time. Here’s a neat example of three different ways to visualize that concept.

Neuroscience is another field filled with uncertainty. Here, regions of the brain are labeled like mountain ranges on a map. No clear boundaries are drawn because the boundaries aren’t precisely known.

Around 70 years later, some structures and functions are known with greater precision. But we still rely on fuzzy edges quite a lot.

Here’s another strategy for dealing with the uncertain geography of the brain. The entire structure is abstracted.

And here, the brain is rendered realistically, but process arrows float above the structure, suggesting that the exact details of those interactions are still a work in progress.

I think that this one (from 1969) is my favorite. Brain inputs—A B and C—and outputs —X, Y, and Z—are more or less understood. However, “far less is known about the workings of regions in between, which make up most of the brain.”

And those of you working in the realm of animal reconstructions have to deal with the challenge of building forms based on incomplete information all of the time. Here, artist Rudolf Freund uses strong line-work to signal what is known, and lighter line-work to signal what is uncertain.

And many of us deal with illustrating processes that aren’t yet fully understood, or hypotheses that aren’t yet proven. Sometimes it may make sense to simply resort to the use of a question mark and inset box, to help flag that a particular interpretation is still not fully embraced.

I’m not trying to suggest that the samples I just shared are perfect examples of visualizing uncertainty. But I think it would be exciting to see how qualitative solutions in general might inform quantitative solutions, and vice-versa.

So with that, I’ll end with a request.
I hope that you’ll join me in thinking on the topic of visualizing uncertainty, as well as developing other ways of strengthening ties and sharing lessons across the broader world of science visualization.

Thanks to Jonathan Corum for inspiring this transcript post format. If you made it to the bottom of this one, I think you’ll find his “Design for an Audience: Science graphics at The New York Times” transcript an enjoyable and informative read.
* * * Image Credits * * *
1-4: Illustrations by April Neander, Art Direction and Graphics by 5W Infographics, in “The Ascent of Mammals” by Stephen Brusatte and Zhe-Xi Luo, Scientific American, June 2016.
5: Illustration by Jen Christiansen, in “A new species of the shrimp genus Chorocaris Martin & Hessler, 1990 (Crustacea Decapoda: Bresiliidae) from hydrothermal vent fields along Mid-Atlantic Ridge” by J. W. Martin and J. C. Christiansen. Proc. Biol. Soc. Wash. 108:220–227, 1995.
6. Illustration by Jen Christiansen, in “Exoskeletal Sensors for Walking” by Sasha N. Hill and Ernst-August Seyfarth, Scientific American, July 1996.
7. LEFT: Graphic by Pitch Interactive, in “The Steady Rise of Ebola,” Scientific American, February 2015 (Sources: “A Comprehensive Database of the Geographic Spread of Past Human Ebola Outbreaks,” by Adrian Mylne et al., in Scientific Data, Vol. 1, Article no. 140042; October 23, 2014 (historical data); Centers for Disease Control and Prevention (2013-2014 data)); RIGHT: Illustration by Cherie Sinnen, in “The End of Orange Juice,” by Anna Kuchment, Scientific American, March 2013
8. LEFT: Interactive by Jan Willem Tulp (Source: Eclipse Predictions by Fred Espenak, NASA GSFC Emeritus), for Scientific American; MIDDLE: Graphic by Amanda Montañez (Source: “The social and cultural roots of whale and dolphin brains,” by Kieran C. R. Fox et al., in Nature Ecology & Evolution, Vol. 1, No. 11; November 2017), for Scientific American; RIGHT: Bryan Christie Design, in “How Seashells Take Shape” by Derek E. Moulton, Alain Goriely and Régis Chirat, Scientific American, April 2018
9. Illustration by Maria Corte Maidagan, in “The Emptiest Place in Space,” by István Szapudi, Scientific American, December 2016
10: Illustration by Jay Bendt, in “The Digital-Subscription Dilemna,” by David Pogue, Scientific American, December 2017
11. LEFT: Illustration by Cherie Sinnen, in “The End of Orange Juice,” by Anna Kuchment, Scientific American, March 2013; RIGHT: Illustration by Maria Corte Maidagan, in “The Emptiest Place in Space,” by István Szapudi, Scientific American, December 2016
12-13. Illustration by Bryan Christie Design, in “The Ultimate Social Network,” by Jennifer Ackerman, Scientific American, June 2012
14. Sketch by Jen Christiansen15. Illustration by Peter and Maria Hoey, in "Halting the World's Most Lethal Parasite," by Mary Carmichael, Scientific American, November 2010
16. Illustration by Leandro Castelao, in “Is Space Digital?” by Michael Moyer, Scientific American, February 2012
17. Illustration by Gavin Potenza, in “Digging Mars,” by Peter H. Smith, in Scientific American, November 2011
18. LEFT: Illustration by Jillian Ditner, in “Black Holes and Wormholes and the Secrets of Quantum Spacetime,” by Juan Maldacena, Scientific American, November 2016; RIGHT: Illustration by Chad Hagen, in “A Geometric Theory of Everything,” by A. Garrett Lisi, and James Owen Weatherall, Scientific American, December 2010
19. Illustration by Bunji Tagawa, Scientific American, March 1975
20. Illustration by Bunji Tagawa, in “The Transplantation of the Kidney,” by John P. Merrill, Scientific American, October 1959
21. Illustration by Bunji Tagawa, in “Computer Inputs and Outputs” by Ivan E. Sutherland, Scientific American, September 1966
22. Graphic by Bunji Tagawa, in “Molecular Motions” by B.J. Alder and Thomas E. Wainwright, Scientific American, October 1959
23. Illustration by Bunji Tagawa, in “The Most Poisonous Mushrooms,” by Walter Litten, Scientific American, March 1975
24. Illustration by Bunji Tagawa, in “An Ancient Greek Computer,” by Derek J. de Solla Price, Scientific American, June 1959
25. Illustration by Bunji Tagawa, in “The Adrenal Chromaffin Cell,” by Stephen W. Carmichael and Hans Winkler, Scientific American, August 1985
26. Graphic by Bunji Tagawa, in “Rocket Astronomy,” by Herbert Friedman, in Scientific American, June 1959
27. Illustration by Don Foley, in “Reading the Red Planet,” by John P. Grotzinger and Ashwin Vasavada, Scientific American, May 2012
28. Illustration by Tami Tolpa, in “Lab-Built Brains,” by Juergen A. Knoblich, Scientific American, January 2017 (Source: “Generation of Cerebral Organoids from Human Pluripotent Stem Cells,” by Madeline A. Lancaster and Juergen A. Knoblich, in Nature Protocols, Vol. 9; October 2014)
29. Graphic by Jan Willem Tulp, in “Planets Everywhere, “by John Matson, Scientific American, December 2012
30. Graphic by Moritz Stefaner, Illustrations by Jillian Walters, in “Where the Wild Bees Are,” by Ferris Jabr, Scientific American, December 2013 (source: “Plant-Pollinator Interactions over 120 Years: Loss of Species, Co-occurrence, and Function,” by Laura A. Burkle, John C. Marlin and Tiffany M. Knight, in Science, Vol. 339; March 29, 2013)
31: Illustrations by April Neander, Art Direction and Graphics by 5W Infographics, in “The Ascent of Mammals” by Stephen Brusatte and Zhe-Xi Luo, Scientific American, June 2016.
32-33. Illustrations by Immy Smith, Research by Amanda Hobbs, in “Buzz Kill,” by Dan Strickman, Scientific American, July 2018
34. Photographs and illustration by Kelly Murphy
35. Photographs and illustration by James Gurney
36. Illustration by Ron Miller, in “8 Wonders of the Solar System,” by Edward Bell, Scientific American, April 2010
37. Illustration by Carol Donner, in “The Heart as a Suction Pump,” by Edmund H. Sonnenblick, Stephen M. Factor and Thomas F. Robinson, Scientific American, June 1986
38. Illustration by Bunji Tagawa, in “The Heart,” by Carl J. Wiggers, Scientific American, May 1957
39. Illustration by John Grimwade, in “Summon the Rain,” by Dan Baum, in Scientific American, June 2014
40-42. Illustration by Emily Cooper, in “Rethinking the Gulf Stream,” by Stephen C. Riser and M. Susan Lozier, Scientific American, February 2013
43. Illustration by Nigel Holmes, in “The Whole Universe Catalog,” by Stephen Ornes, Scientific American, July 2015
44. LEFT: Reyes-Gil, Karla & M. Spurgeon, Joshua & S. Lewis, Nathan. (2009). Silicon and tungsten oxide nanostructures for water splitting. Proc SPIE. 7408. 10.1117/12.825545; RIGHT: Illustration by Cherie Sinnen, in “Reinventing the Leaf,” by Antonio Regalado, Scientific American, October 2010
45. Sketches and Graphic by Moritz Stefaner, Illustrations by Jillian Walters, in “Where the Wild Bees Are,” by Ferris Jabr, Scientific American, December 2013 (source: “Plant-Pollinator Interactions over 120 Years: Loss of Species, Co-occurrence, and Function,” by Laura A. Burkle, John C. Marlin and Tiffany M. Knight, in Science, Vol. 339; March 29, 2013
46-47. Graphic by Accurat, in "Scientists Trace Society's Myths to Primordial Origins,” by Julien d'Huy, Scientific American, December 2016
48. Graphic by Zan Armstrong and Nadieh Bremer, in “The Baby Spike,” by Mark Fischetti and Zan Armstrong, Scientific American, July 2017
49. Graphic by Jen Christiansen, in "Not Just for Men,” by Marcia L. Stefanick, Scientific American, September 2017 (Source: Treatment Strategies for Women with Coronary Artery Disease: Future Research Needs, by Rowena J. Dolor et al. Comparative Effectiveness Review No. 66 Agency for Healthcare Research and Quality, Department of Health and Human Services, August 2012)
50-51. Excerpt from “What would feminist data look like?” By Catherine D’Ignazio, December 2015
52-53. Excerpt from “What is Missing is Still There” by Mimi Onuoha
54. Graphics by Jen Christiansen, Research by Amanda Hobbs, in “Infections by the Numbers,” Scientific American, May 2018
55. TOP LEFT: Illustration by Ron Miller; BOTTOM LEFT: Illustration by Carol Donner; TOP RIGHT: Graphic by Accurat; BOTTOM RIGHT: Graphic by Jen Christiansen
56. Graphic by Jen Christiansen, in “The Neutron Enigma,” by Geoffrey L. Greene and Peter Geltenbort, Scientific American, April 2016
57. Graphic by Jen Christiansen, in “Up, Up and Away,” by Mark Fischetti, in Scientific American, December 2014
58. Illustration by Katy Wiedemann, in “Where We Came From,” in Scientific American, September 2014 (source: Bernard Wood)
59. Illustration by Jen Christiansen, in "Crossing the Quantum Divide,” by Tim Folger, Scientific American, July 2018
60. Illustration by Jen Christiansen, in “Beyond the Quantum Horizon,” by David Deutsch and Artur Ekert, Scientific American, September 2012
61. Illustration by George Kelvin, in “Squeezed Light,” By Bernard Yurke and Richart E. Slusher, Scientific American, May 1988
62. Illustration by George Kelvin, in “Quantum Gravity,” by Bryce S. DeWitt, Scientific American, December 1983
63. Illustration by Eric Mose, in “The Great Ravelled Knot,” by George W. Gray, Scientific American, October 1948
64. Illustration by AXS Studio, in “The Case of the Sleeping Slayer,” by James Vlahos, Scientific American MIND, September 2012
65. Illustration by Bunji Tagawa, in “Brain Mechanisms of Movement,” By Edward V. Evarts, Scientific American 1979
66. Illustration by AXS Studio, in “Good Habits, Bad Habits,” by Ann M. Graybiel and Kyle S. Smith, Scientific American, June 2014
67. Illustration by Ilil Arbel, In “The Brain,” By David H. Hubel, Scientific American, September 1979
68. Illustration by Rudolf Freund, In “The Early Relatives of Man,” By Elwyn L. Simons, Scientific American, July 1964
69. Illustration by Chad Hagen, In “Goldilocks Black Holes,” By Jenny E. Greene, Scientific American, December 201