This article was published in Scientific American’s former blog network and reflects the views of the author, not necessarily those of Scientific American
Since 2013, scientist and data graphics guru Martin Krzywinski has been celebrating “Pi Day” by visualizing the famous mathematical value in original and fascinating ways. This year, inspired by the recent announcement of the discovery of gravitational waves by LIGO scientists, Martin has dropped a complex new variable into his latest visualization: gravity.
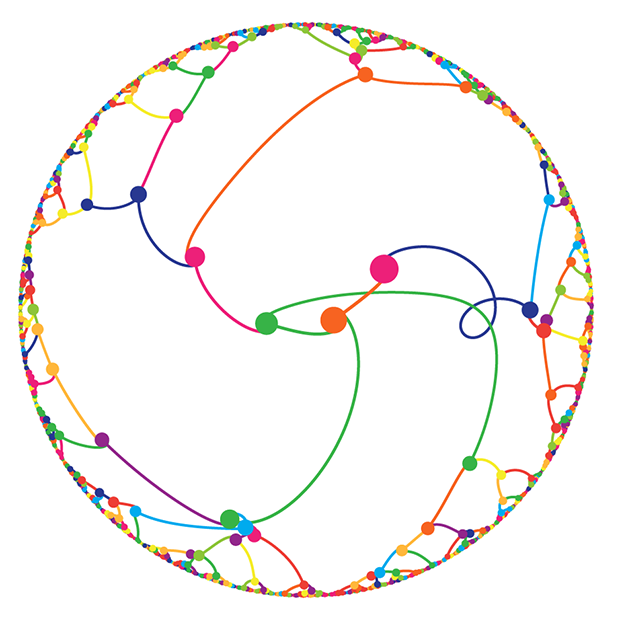
Like the interaction of physical masses, this visualization is governed by a set of laws. It starts with the first n digits of pi, each represented as a colored dot and arranged in a circle. The color of each digit signifies its value based on a rainbow scale of magenta to violet. The value of n could be anything, from three (3, 1, 4) to 1,000. Each digit is assigned a mass according to a mathematical formula including a second variable, k. The interactions of the masses are then visualized as paths connecting them. At times, masses come to orbit each other; in other instances they collide, coalescing into a larger mass whose increased gravity intensifies its impact on the other bodies around it.
Depending on the respective values of n and k, the visualization experiences various permutations. As the values increase, the interplay of forces becomes more dramatic and complex, the path winding and looping around itself, often breaking the bounds of the circle and veering into graphical oblivion. In some instances, as in the one below, all the digits eventually collide into a single mass within the circle.
On supporting science journalism
If you're enjoying this article, consider supporting our award-winning journalism by subscribing. By purchasing a subscription you are helping to ensure the future of impactful stories about the discoveries and ideas shaping our world today.

Pi Day 2016 Graphic by Martin Krzywinski
Visit Martin’s website to read more about his process and see other variations on the visualization.