This article was published in Scientific American’s former blog network and reflects the views of the author, not necessarily those of Scientific American

Credit: AXS Studio (Contributors: Man-San Ma, Sonya Amin, Eddy Xuan, Joyce Hui, and Susan Park)
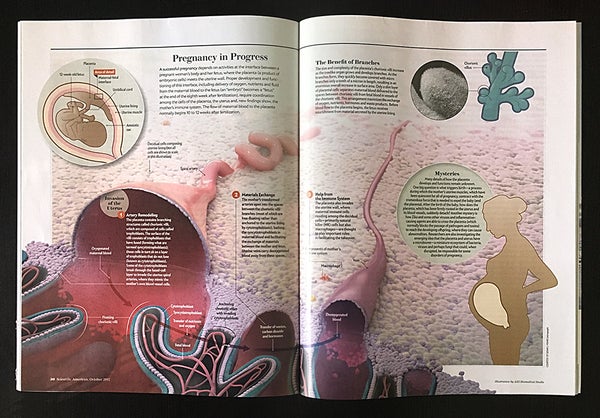
At Scientific American, we specialize in making advances in science and technology accessible to non-specialist audiences. That includes developing illustrated explanatory diagrams and data visualizations that both explain the latest research findings in depth, and place those findings in context of the larger research arc. That may sound straightforward, but many newsworthy topics in science stand on a foundation of lots of incremental research findings, most of which we can’t assume that our readers already know. And some of which haven’t been illustrated clearly before. For an article in this month’s issue on the placenta, for example, we were attempting to show newly emerging details on placental development for which very little visual reference material already existed.
Luckily, we had a direct line to several research scientists, including Adrian Erlebacher, Susan J. Fisher, and Michael McMaster (all from the University of California, San Fransisco) for their content expertise. And I could lean quite heavily on the artists at AXS Studio, medical illustrators well-prepared to take on the topic. (Indeed, AXS Studio co-founder Sonya Amin has a background in developmental biology). For projects like this one, it’s a huge relief knowing that I don’t need to track down reference material for every detail—like cell shapes and sizes, and basic anatomy—and instead focus on simply connecting the scientists and artists, and facilitating conversations between them that focus on how to represent the newest findings.
On supporting science journalism
If you're enjoying this article, consider supporting our award-winning journalism by subscribing. By purchasing a subscription you are helping to ensure the future of impactful stories about the discoveries and ideas shaping our world today.
When developing graphics for Scientific American, I usually aim for a pretty streamlined three-step process: (1) concept sketch, (2) tight sketch, and (3) final art. Often there are feedback loops that focus in on specific details within the illustration. But the overall structure should really lock in as soon as possible, as we don’t have the time or resources to let things meander too much. And I’ve found that really thinking things through completely at the start of the project saves a lot of time and energy later on. In my role as a graphics editor juggling projects with many different artists, editors, and expert consultants, it’s really helpful to have a clear structure with benchmarks that that help keep projects focused and on track.
But in this case—due to the complexity of the topic—we got caught in a few feedback loops. I kicked things off with the first concept sketch to get the conversation rolling, then AXS jumped in and adjusted the plan as more of the content details came into focus. For example, it became clear pretty quickly to Sonya and her team that my initial idea of including a large fetus in utero with the cellular details highlighted in a cutaway cube wasn’t the best use of page real estate. They ditched that idea and zoomed into the cellular level for the main image, which evolved into a landscape-like view of the place at which the placenta and uterine wall meet. (Sketch progression is shown in the animation below). Once the primary composition settled into place and the concept was pinned down, there was still a long way to go, as the scientists talked the artists through lesser-known and newly emerging anatomical and cellular details—many for which there was no pre-existing visual reference material, and some of which were hashed out on conference calls with screen-share enabled so that AXS artist Man-San Ma could mark up and edit sketches in real-time on-screen, and obtain immediate feedback.
Credit: AXS Studio (Contributors: Man-San Ma, Sonya Amin, Eddy Xuan, Joyce Hui, and Susan Park); Jen Christiansen (art direction)
I have to admit that at times I wasn’t sure that we’d ever get this one finalized. But I can also say that at every step along the way, I felt incredibly fortunate to be able to work with such a knowledgeable group of artists and scientists, all determined to get the details right. And secure in the knowledge that I had the right artists for the job on the case.
For a closer look at the final product, see “Baby’s First Organ,” by Adrian Erlebacher and Susan J. Fisher in the October, 2017 issue of Scientific American.