This article was published in Scientific American’s former blog network and reflects the views of the author, not necessarily those of Scientific American
Fireworks have long charmed the editors of Scientific American, with coverage starting in 1846 and running the gamut from reports of industrial accidents, to World's Fair displays, and the science of pyrotechnics.
From "Firework Making" in the June 15, 1878 issue,
"The art is, if not really a secret one, very little known to the general public, owing to the danger attending the manufacture, which prevents casual visitors inquiring, and to the nature of the product, which offers no inducements to the analyst.
In calling special attention to pyrotechny as an art well worth cultivating, even though apparently an expensive luxury, we desire to laud the wondrous aesthetic effects of light and color…"
On supporting science journalism
If you're enjoying this article, consider supporting our award-winning journalism by subscribing. By purchasing a subscription you are helping to ensure the future of impactful stories about the discoveries and ideas shaping our world today.
In an effort to "laud the wondrous aesthetic effects of light and color," here are some of my favorite graphics from the archive on the topic.

The Fireworks at the Columbian Exposition—How Some Striking Effects were Obtained. Credit: Scientific American, December 2, 1893

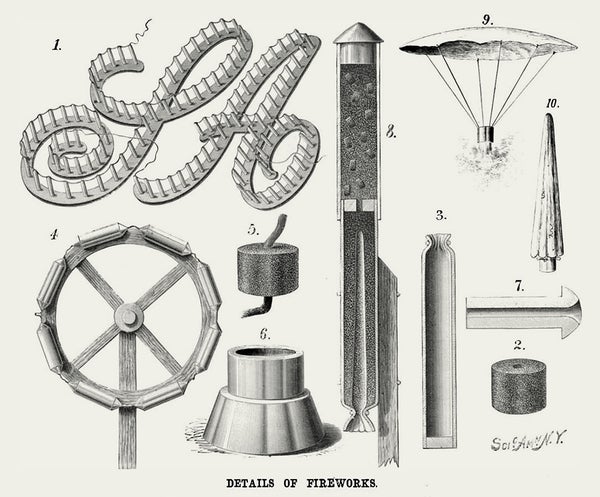
From “Firework Making” Credit: Scientific American, June 15, 1878

Credit: Illustration by SlimFilms / Bryan Christie. Originally produced for “Aerial Fireworks,” By George R. Zambelli, Sr., Scientific American, July 1999.

Credit: Illustration by Andrew Christie. Originally produced for “Pyrotechnics,” By John A. Conkling, Scientific American, July 1990