This article was published in Scientific American’s former blog network and reflects the views of the author, not necessarily those of Scientific American
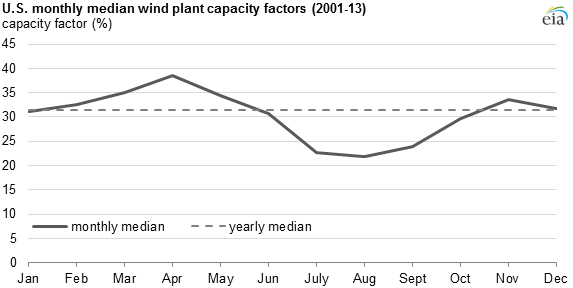
The nation’s wind farms perform at their best during the spring and their worst during the mid-to-late summer, according to the U.S. Energy Information Administration (EIA).
This variability stems from the fact that wind patterns change not only across regions, but also by the time of the year. In turn, the amount of power generated by wind farms can change considerably from season to season.
The amount of electricity that is generated by a power plant compared to the total potential generation is called its “capacity factor”. For example, if a power plant operated 30% of the year but could theoretically have operated 100% of the time, you would say that it has a 30% capacity factor.
On supporting science journalism
If you're enjoying this article, consider supporting our award-winning journalism by subscribing. By purchasing a subscription you are helping to ensure the future of impactful stories about the discoveries and ideas shaping our world today.
According to the EIA, capacity factors for wind power in the United States typically rise or are flat from January through April, fall through August or September, and then increase from September/October to December.

Credit: U.S. Energy Information Administration (only includes data for facilities with a net summer capacity of 1 MW and above).
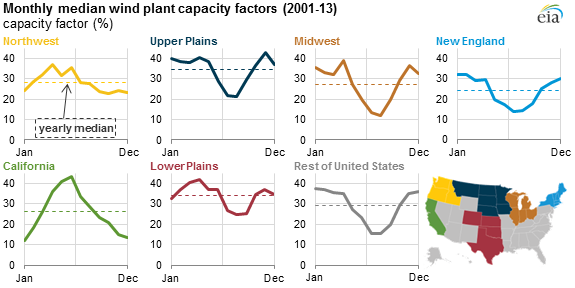
This pattern is a generalization, however, with notable differences between regions.
For example, in New England, wind’s median capacity factor in January sits at 32% versus 14% in July. California, on the other hand, has almost the opposite profile. In this state, wind’s capacity factor rises for the first half of the year and then drops for the subsequent 6 months. Overall, California’s wind farms operate with a 25% capacity factor with a median of ~15% in the winter and closer to 30% in the summer.

Credit: U.S. Energy Information Administration (only includes data for facilities with a net summer capacity of 1 MW and above).
This seasonal variability can impact the potential role of wind in some regions of the country. In states with high summer electricity demand and lower summer wind capacity factors (for example, Texas), utilities might need to compensate for the seasonal variability as increasing amounts of wind are introduced into the electricity mix. This could mean installing more wind power capacity (i.e. more turbines) or using other technologies (e.g. seasonal energy storage, non-wind power plants).
