This article was published in Scientific American’s former blog network and reflects the views of the author, not necessarily those of Scientific American
We often hear news about the plummeting cost of natural gas, wind, and solar generation (and the poor prospects of coal), but almost no attention is paid to the cost of the grid itself. The wires, poles, substations, transformers, control center operators, utility line workers, and hundreds of other components and individuals that make up the electric grid are absolutely vital — yet their cost is rarely included in critical discussions about the transformation of the electricity sector and pathways to decarbonization.
I dug through years of data collected by the U.S. Federal Energy Regulatory Commission (FERC) and the Edison Electric Institute (EEI) to get an idea of just how much the U.S. electric grid costs. The end results are shown in the graphs below. Similar graphs appeared in a paper of mine recently published in the journal Energy Policy. They show average transmission, distribution, and administrative costs for U.S. investor-owned utilities between 1960 and 2015. Transmission is the high-voltage lines that move power over long distances, distribution is the low-voltage lines that bring power into buildings, and administrative costs are for managing customers’ accounts, reading meters, utility office buildings, administrative staff, etc.
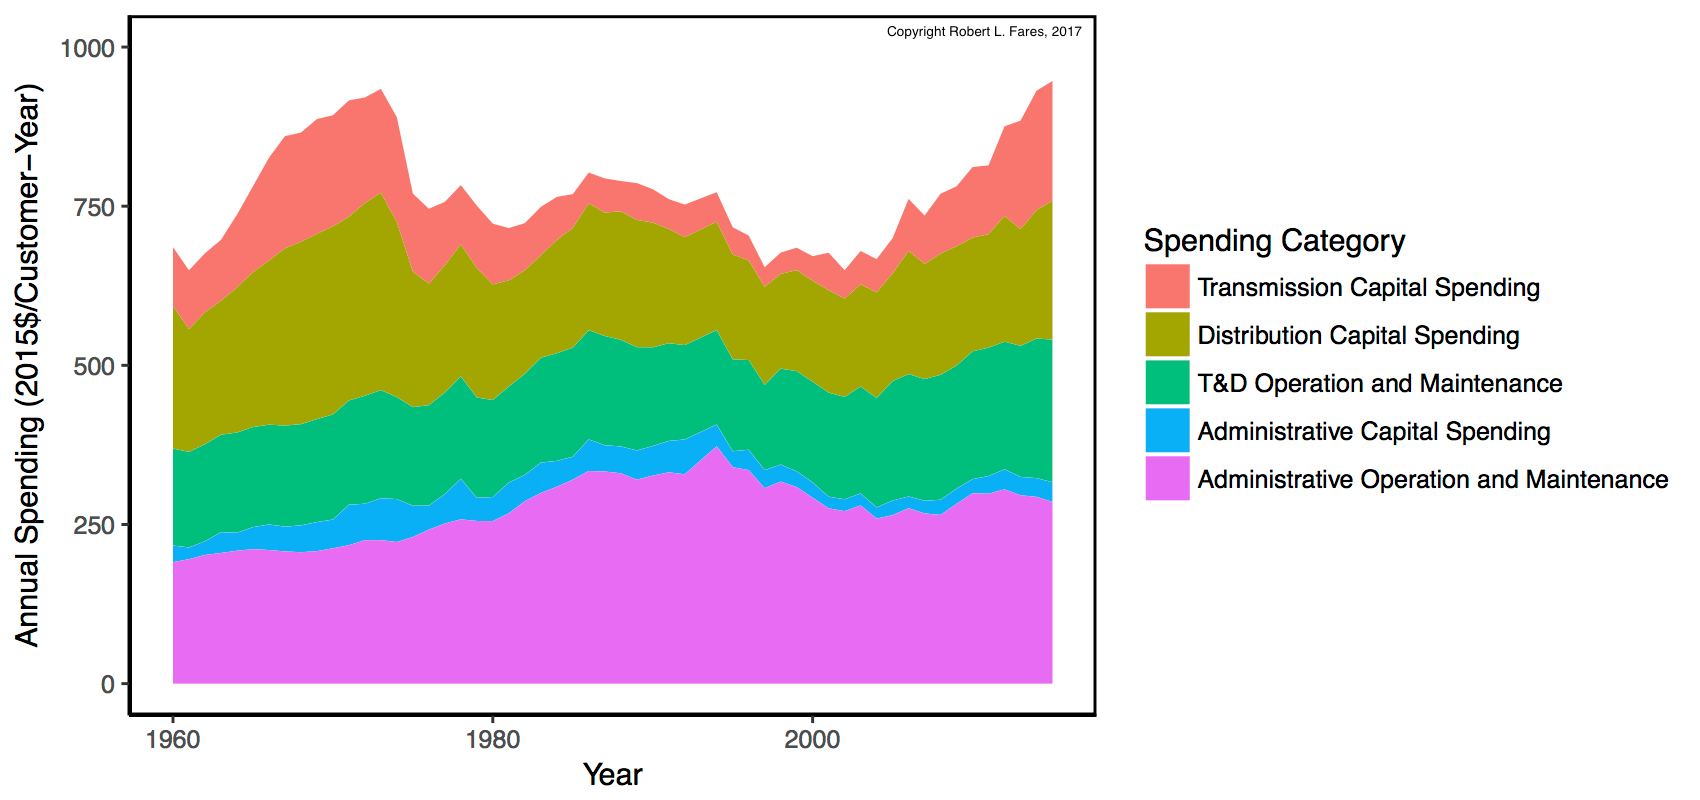
Average annual transmission, distribution, and utility administration costs have been roughly $700–$800 per customer per year for much of the past 54 years. Credit: Robert Fares using FERC Form 1 data and EEI data
On supporting science journalism
If you're enjoying this article, consider supporting our award-winning journalism by subscribing. By purchasing a subscription you are helping to ensure the future of impactful stories about the discoveries and ideas shaping our world today.
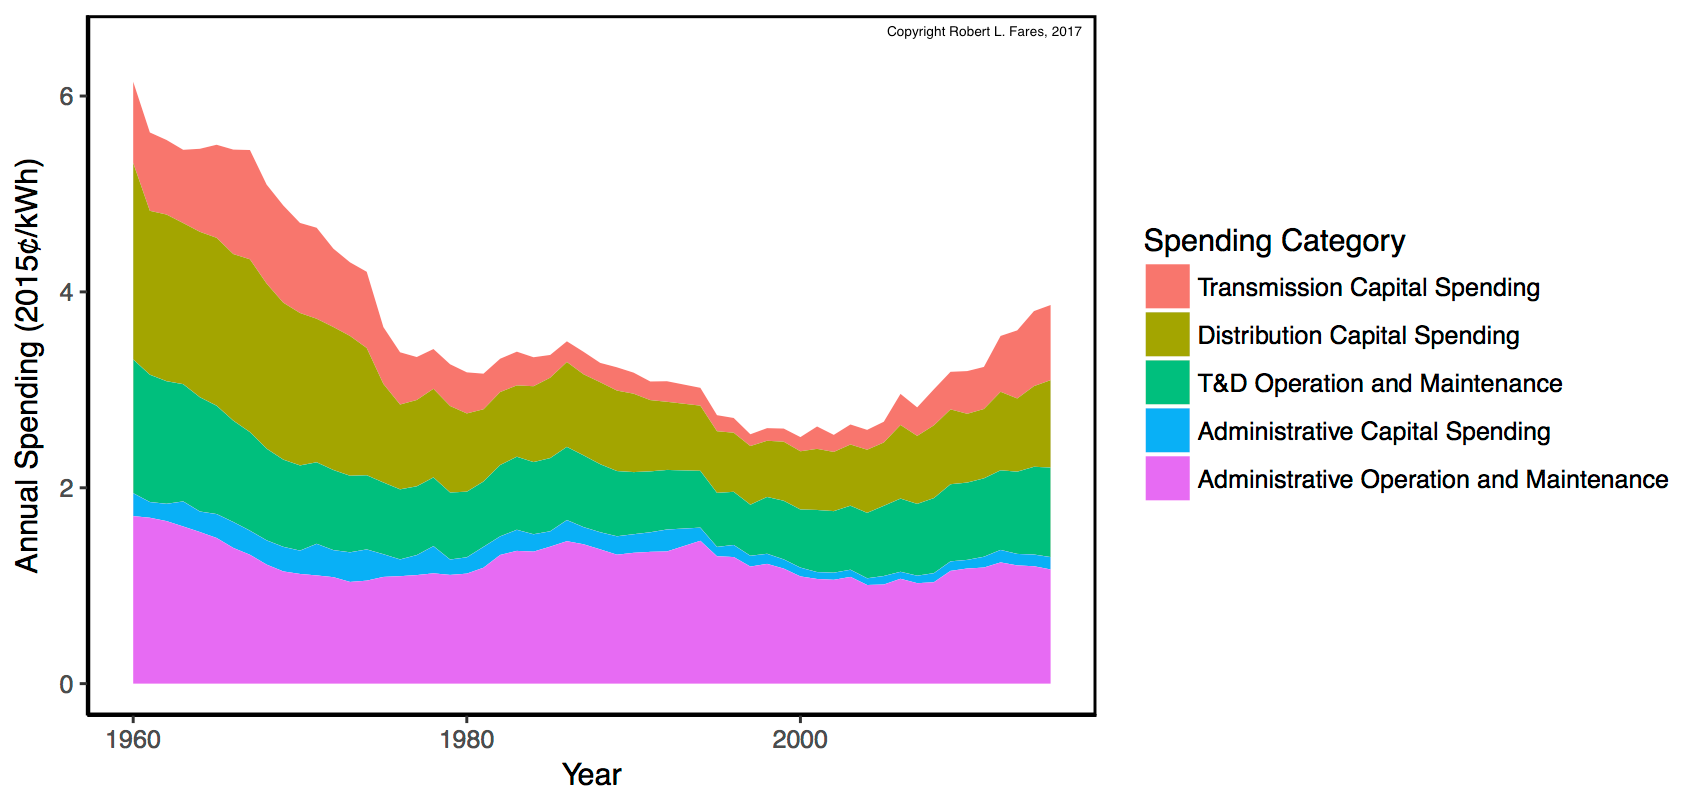
Average annual transmission, distribution, and administration costs per kilowatt-hour (kWh) of energy sold declined rapidly between 1960 and 1980, but have been approximately 2.5-3.5 ¢/kWh since 1980. The decrease between 1960 and 1980 was likely driven by increasing energy consumption rather than decreasing service costs. Credit: Robert Fares using FERC Form 1 data and EEI data
I show the costs in two ways: normalized per utility customer, and normalized per kilowatt-hour (kWh) of energy sold. Both of the charts illustrate some surprising facts about the cost of the grid. First, administrative costs are more than a third of total grid costs, indicating that a significant portion of the price we pay for electricity goes to just running the utility business. Second, total grid costs per customer and per kWh have increased significantly in recent years. It’s hard to say exactly what’s behind this increase, but it’s likely related to grid hardening efforts in response to storms such as Superstorm Sandy, and building out of transmission and distribution grids to accommodate both large-scale and distributed renewable energy.
Perhaps the most interesting conclusion to be drawn from the graphs comes from their differences. When we look at costs per utility customer, as shown in the first graph, the total cost has been remarkably steady since 1960, with a peak during a major buildout in the 1970s and a growing peak today. However, when we look at the cost per kWh of energy sold, the cost was considerably higher in the 1960s. Why? Because the average customer used about half as much energy in 1960 versus the average customer today. This indicates the main driver of grid costs is the number of electricity customers, and not how much energy they use. In other words, the number of customers connected to the grid determines how many power lines, transformers, meters, and utility staff are required to reliably deliver electricity. It makes sense.
This finding is important because it relates to the ongoing policy debate related to paying for the grid even as more and more utility customers adopt rooftop solar panels. Rooftop solar panels reduce the amount of kWh customers buy from the utility, but they don’t decrease the cost of connecting customers to the grid. Thus, as more customers reduce their kWh consumption using solar panels, the cost of the grid per kWh of energy sold will approach the high values seen in the 1960s — and electricity prices will go up for everyone.
The trends in grid costs revealed through my analysis are just a small part of an ongoing debate about the future of electric utilities and paying for the electric grid. I highly recommend the Future of Electric Utility Regulation Series by Lawrence Berkeley National Laboratory for a deep dive on technical and policy issues related to the future of the electric grid.