This article was published in Scientific American’s former blog network and reflects the views of the author, not necessarily those of Scientific American
Five Category 5 tropical cyclones troubled Earth’s tropical waters in 2019--two hurricanes in the Atlantic: Dorian (185 mph) and Lorenzo (160 mph), and three super typhoons in the Northwest Pacific: Wutip (160 mph), Hagibis (160 mph), and Halong (180 mph). Earth averaged 5.3 Category 5 storms per year between 1990 and 2018, according to ratings made by NOAA's National Hurricane Center and the U.S. Navy's Joint Typhoon Warning Center, so 2019’s activity was near-average. Cat 5 activity over the previous five years (except for 2017) had been much above average, though (Figure 1).
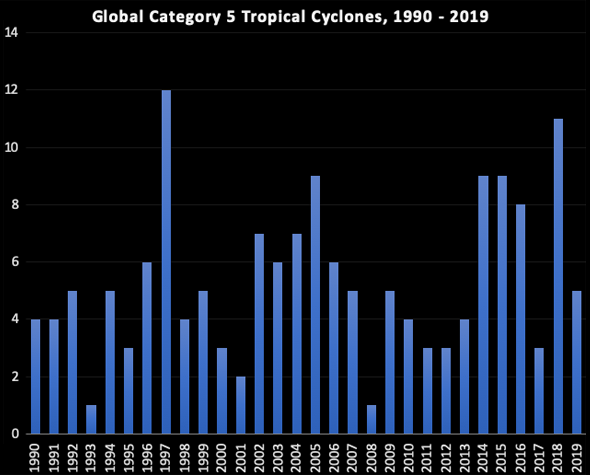
Figure 1. Global Category 5 tropical cyclones from 1990 - 2019, as rated by NOAA's National Hurricane Center and the U.S. Navy's Joint Typhoon Warning Center. The quality of the database that rates Cat 5s is too poor and the time series of decent data on these storms is too short to make definitive conclusions about how climate change may be affecting these most fearsome of storms. However, climate change is expected to make Category 5 storms stronger and more numerous in the coming decades. Credit: Jeff Masters
One of 2019’s Cat 5s made landfall at category 5 strength—Hurricane Dorian in The Bahamas, with 185 mph winds, which tied for third place for the world’s strongest landfalling tropical cyclone in recorded history. Two of the Cat 5s of 2019 ended up being billion-dollar disasters: Hurricane Dorian, with nearly $10 billion in damage in The Bahamas, Leeward Islands, U.S., and Canada; and Typhoon Hagibis, with $15 billion in damage to Japan—Japan’s second most expensive typhoon in history. Below is a rogues gallery of all five Category 5 storms of 2019.
On supporting science journalism
If you're enjoying this article, consider supporting our award-winning journalism by subscribing. By purchasing a subscription you are helping to ensure the future of impactful stories about the discoveries and ideas shaping our world today.
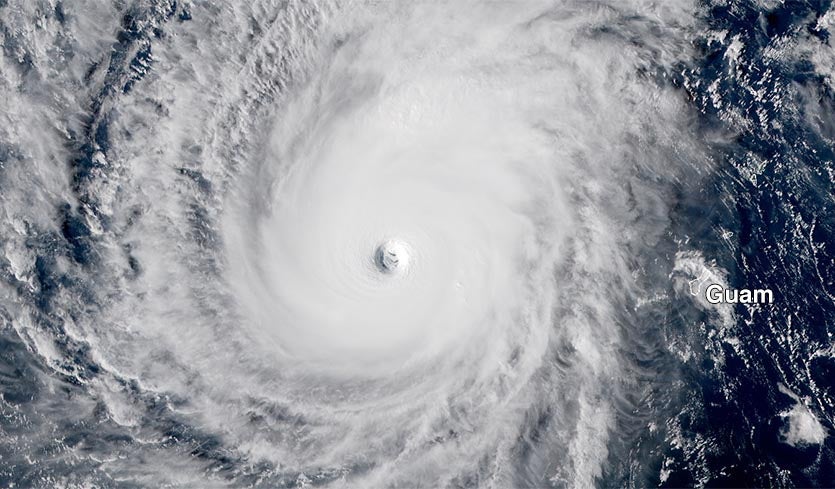
Figure 2. Himawari-8 infrared image of Super Typhoon Wutip taken at 2:10 am EST Monday, February 25, 2019. At the time, Wutip was a Category 5 storm with 160 mph winds--the first Northern Hemisphere Category 5 tropical cyclone on record in February. Credit: NOAA and RAMMB
Super Typhoon Wutip: first February Cat 5 ever recorded in the Northern Hemisphere
The first Cat 5 of 2019 was Typhoon Wutip, which passed over Chuuk, Pohnpei, and Yap states in the Federated States of Micronesia from February 19 - 22 as a Category 2 typhoon with sustained winds of 100 mph, causing at least $2 million in damage. On February 23, an intensifying category 3 Wutip passed about 180 miles southwest of Guam, bringing southern Guam sustained tropical storm-force winds, torrential rains of 8 – 12”, and waves up to 20 feet high. Damage in Guam was estimated at $1.3 million.
Wutip then underwent an impressive burst of rapid intensification in the waters approximately 300 miles west of Guam, topping out as category 5 super typhoon with a central pressure of 915 mb and sustained winds of 160 mph at 6 GMT February 25. This made Wutip the first Category 5 storm ever observed in the Northern Hemisphere in the month of February. Wutip did not affect any land areas after passing Guam.
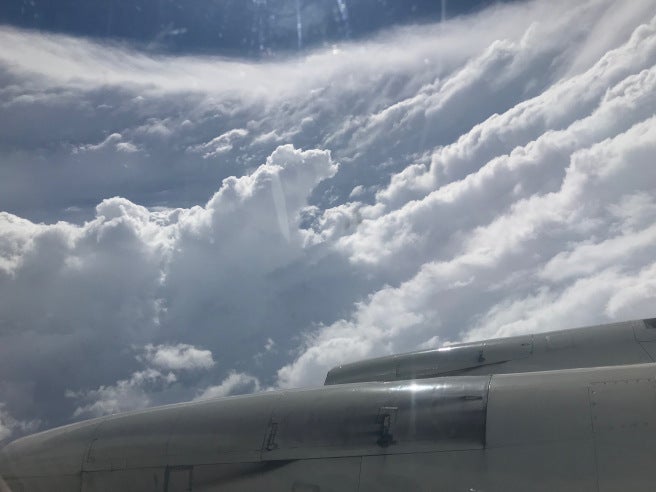
Figure 3. The classic “stadium effect” as seen in the eye of Hurricane Dorian from NOAA hurricane hunter aircraft N42RF on September 1, 2019. The NOAA and Air Force Hurricane Hunters set a record for the most missions ever taken into a single hurricane during Dorian: 51 missions were tasked. Credit: NOAA Hurricane Research Division
Hurricane Dorian: third strongest landfalling tropical cyclone in world history
After hitting St. Thomas in the U.S. Virgin Islands as a category 1 hurricane on August 28 and causing $150 million in damage to the Caribbean islands, Hurricane Dorian rapidly intensified into a category 5 mega-hurricane that powered ashore on Great Abaco Island in The Bahamas on September 1, 2019 with sustained winds of 185 mph. This puts Dorian in a tie for third strongest landfalling tropical cyclone in world history. Ominously, eight of the top ten strongest landfalling tropical cyclones in world history have occurred since 2006 (as estimated using wind speed estimates from the National Hurricane Center and Joint Typhoon Warning Center):
1. Super Typhoon Haiyan, 190 mph, 2013 (Samar, Philippines)
1. Super Typhoon Meranti, 190 mph, 2016 (Itbayat, Philippines)
3. Hurricane Dorian, 185 mph, 2019 (Bahamas)
3. Super Typhoon Joan, 185 mph, 1959 (Taiwan)
3. Great Labor Day Hurricane, 185 mph, 1935 (Florida, U.S.)
6. Super Typhoon Yutu, 180 mph, 2018 (Northern Mariana Islands, U.S.)
6. Hurricane Irma, 180 mph, 2017 (Leeward Islands)
6. Cyclone Winston, 180 mph, 2016 (Fiji)
6. Super Typhoon Megi, 2010, 180 mph (Luzon, Philippines)
6. Super Typhoon Zeb, 1998, 180 mph (Luzon, Philippines)
6. Cyclone Monica, 2006, 180 mph (Australia)
At landfall, Dorian was moving at just 5 mph, and portions of Dorian’s eyewall lashed Great Abaco and Grand Bahama islands with Category 5 winds for a total of 22 hours before the great hurricane finally weakened to Category 4 strength. Dorian’s extreme winds, storm surge of 20 – 25 feet, and rains of up to 3 ft (0.9 m) of rain combined to bring the Bahamas their most devastating natural disaster in history. A November 15 report from the Inter-American Development Bank put damage in The Bahamas from Dorian at $3.4 billion—over 25% of their $12 billion GDP, and their most expensive disaster in history. Insurance broker Aon put Dorian’s damages at over $8 billion. Dorian killed 70 and left 300 people missing in The Bahamas, according to reliefweb.com.
Dorian’s stall allowed the hurricane’s winds to upwell enough cool water to significantly weaken the storm, and the hurricane made landfall on September 6 at Cape Hatteras, North Carolina as a Category 1 hurricane with 90 mph winds and a minimum central pressure of 956 mb. Dorian killed ten people in the U.S., cost $1.4 billion, and spawned a political firestorm—Sharpiegate—after President Trump incorrectly tweeted on September 1 that Alabama would “most likely be hit (much) harder than anticipated.”
Dorian also hit Canada hard, making landfall in eastern Nova Scotia on September 7 as an extratropical cyclone with Category 2 winds of 100 mph and a pressure of 958 mb, making it the third strongest hurricane or ex-hurricane on record to hit Canada. Damage in Canada was estimated at $200 million.
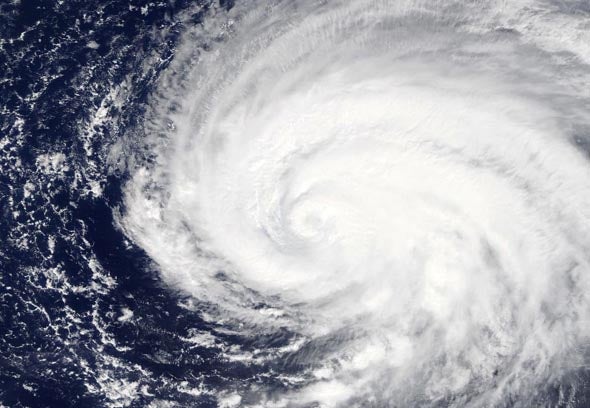
Figure 4. Hurricane Lorenzo in the eastern Atlantic as seen on September 29, 2019 by the MODIS instrument on the Terra satellite. At the time, Lorenzo was a category 5 storm with 160 mph winds. Credit: NASA
HURRICANE LORENZO BECOMES THE EASTERNMOST ATLANTIC CAT 5 AND MOST DESTRUCTIVE AZORES STORM ON RECORD
Hurricane Lorenzo intensified into a category 5 hurricane with 160 mph winds at 45°W on September 29, becoming the easternmost Atlantic category 5 storm on record. Lorenzo spent 3 ½ days as a major hurricane east of 45°W—the longest period of time on record that a major Atlantic hurricane has existed so far to the east (previous record: 1.75 days by Hurricane Carrie in 1957).
The French ocean tug Bourbon Rhode capsized in huge waves spawned by Lorenzo on September 27; among its fourteen crew members, eleven were killed. Throughout late September and early October, huge swells radiated from the hurricane's massive wind field, impacting much of the Atlantic basin. More that 2000 miles west of the storm, eight people drowned in rip currents along the U.S. coast.
A weakening Lorenzo passed 55 miles north of Flores Island in the Azores on October 2 as a Category 1 hurricane with 90 mph winds. Lorenzo brought sustained hurricane-force winds of 74 mph to nearby Corvo Island. Winds of this strength have rarely been experienced in the Azores, and Lorenzo caused major damage, particularly on Flores. The government estimated damage at $367 million--primarily to port infrastructure—making Lorenzo the costliest hurricane in Azores history. According to EM-DAT (the international disaster database) and National Hurricane Center storm summaries, there are no records of any other hurricane causing significant damage in the Azores.
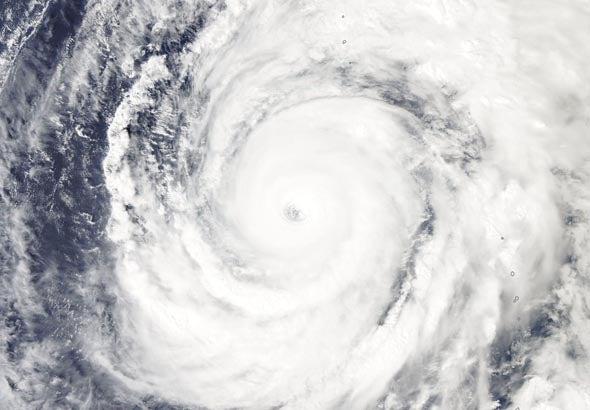
Figure 5. Super Typhoon Hagibis as seen on October 9, 2019 by the MODIS instrument on the Aqua satellite. At the time, Hagibis was a category 5 storm with 160 mph winds. Credit: NASA
Typhoon Hagibis--Japan’s second most expensive typhoon in history, at $15 billion
Super Typhoon Hagibis peaked as a category 5 storm with 160 mph winds and a central pressure of 904 mb on October 10 in the waters southwest of Japan. High wind shear and cooler waters caused Hagibis to weaken as it headed toward Japan, but the massive typhoon still caused Japan’s second most expensive typhoon strike in history after roaring ashore in the Nagano prefecture on October 12, 2019 as a category 2 storm with 100 mph winds. Hagibis tracked over the Tokyo metropolitan area and unleashed unprecedented rains and catastrophic flooding across much of Japan, and was the wettest typhoon in Japan’s history, with 922.5 mm (36.3”) of rain falling in 24 hours at Hakone. Hagibis killed 98 and caused over $15 billion in damage, making it Earth’s most expensive weather-related disaster of 2019. Hagibis came just two months after the landfall of Typhoon Faxai, which also made landfall as a category 2 storm and tracked over Tokyo. Faxia did $7 billion in damage, making it Japan’s seventh most expensive typhoon on record.
According to inflation-adjusted damage estimates from Aon and EM-DAT, three of the top ten most damaging Japanese typhoons since 1950 have occurred since 2018. A fourth typhoon, Trami of 2018, with $4.6 billion in damage, just missed making the list:
Mireille, 1991, $19.1 billion
Hagibis, 2019, $15 billion
Jebi, 2018, $12.6 billion
Songda, 2004, $12.5 billion
Flo, 1990, $8.0 billion
Bart, 1999, $7.8 billion
Faxai, 2019, $7.0 billion
Vera, 1959, $5.3 billion (5098 deaths)
Sarah, 1986, $5.1 billion
Vicki, 1998, $4.8 billion
This list does not include the $10.2 billion flood disaster in southern Japan in July 2018, which was caused by the presence of a stationary seasonal frontal boundary enhanced by remnant moisture from Typhoon Prapiroon. Hurricane scientists agree that typhoons in the Northwest Pacific are reaching their maximum intensities at a more northerly latitude than they used to, which has increased the typhoon risk to Japan. In a 2019 review paper by 11 hurricane scientists, Tropical Cyclones and Climate Change Assessment: Part I. Detection and Attribution, nine of 11 authors concluded that the balance of evidence suggested that human-caused climate change contributed to the observed poleward migration of more intense typhoons.
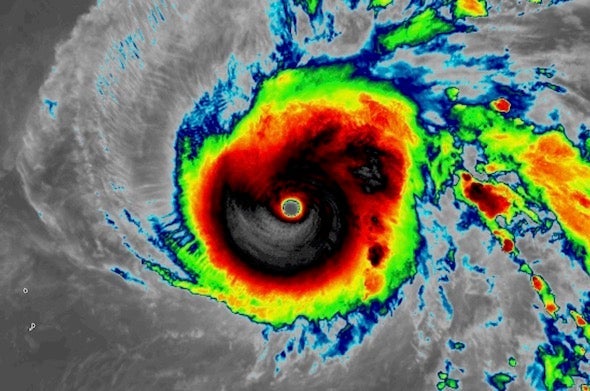
Figure 6. Himawari-8 infrared satellite image of Super Typhoon Halong at 18 GMT (1 pm EST) November 5, 2019. At the time, the Joint Typhoon Warning Center (JTWC) rated Halong a category 5 storm with 180 mph sustained winds and a central pressure of 897 mb; the University of Wisconsin CIMSS group rated Halong as having winds of 192 mph, making it the 8th strongest tropical cyclone on record since accurate satellite measurement began in 1979. Credit: NOAA RAMMB and CIRA
Super Typhoon Halong: 8th strongest tropical cyclone in world history?
The final Cat 5 of 2019 was Super Typhoon Halong, which peaked at 180 mph winds and a central pressure of 897 mb at 18 GMT November 5, according to the Joint Typhoon Warning Center (JTWC). They classify a typhoon with winds that strong every two years or so. As I discussed in a November 8 post, a truly eye-opening estimate of Halong’s intensity came from an independent assessment using an advanced satellite technique developed by scientists at the University of Wisconsin. That method, called the Advanced Dvorak Technique (ADT), is more suitable for generating ratings to compare historical storms with. The ADT rated Halong as having 192 mph winds, making it the eighth strongest tropical cyclone seen worldwide since the era of reliable satellite measurements began in 1979.
The almost-Cat 5 of 2019
Two other tropical cyclones just missed achieving Category 5 status in 2019, topping out with 155 mph winds (157 mph winds are the threshold for a Cat 5): Cyclone Fani in the North Indian Ocean on May 2, and Cyclone Ambali in the Southwest Indian Ocean. Ambali is notable for setting a mark for the largest 24-hour intensification on record in the Southern Hemisphere, after it jumped from 35 knots (40 mph) to 135 knots (155 mph) in just 24 hours. The previous record was 95 knots (110 mph) from Cyclone Ernie in 2017. Ambali’s intensification mark falls just short of the world record for 24-hour intensification set by Hurricane Patricia of 2015 of 105 knots (120 mph), when the storm was off the Pacific coast of Mexico.
ARE THE STRONGEST TROPICAL CYCLONES GETTING STRONGER?
Theory suggests that a warming climate should make the strongest tropical cyclones stronger, since hurricanes are heat engines that extract heat energy from the oceans, converting it to kinetic energy in the form of wind. In a 2019 Review Paper by 11 hurricane scientists, “Tropical Cyclones and Climate Change Assessment: Part I. Detection and Attribution”, ten of 11 authors concluded that the balance of evidence suggests that there is a detectable increase in the global average intensity of global hurricanes since the early 1980s; eight of 11 authors concluded that the balance of evidence suggests that human-caused climate change contributed. All 11 authors agreed that the balance of evidence suggests that the proportion of all hurricane reaching Category 4-5 strength has increased in recent years; eight of 11 authors concluded that the balance of evidence suggests that human-caused climate change contributed. I’m featured in a recent 5-minute video by Peter Sinclair of Yale Climate Connections on how hurricanes are changing in the new climate.