This article was published in Scientific American’s former blog network and reflects the views of the author, not necessarily those of Scientific American
Actual solar electricity production in the United States is 50% higher than previous estimates, according to new analysis by the Solar Energy Industries Association (SEIA) and kWh Analytics.
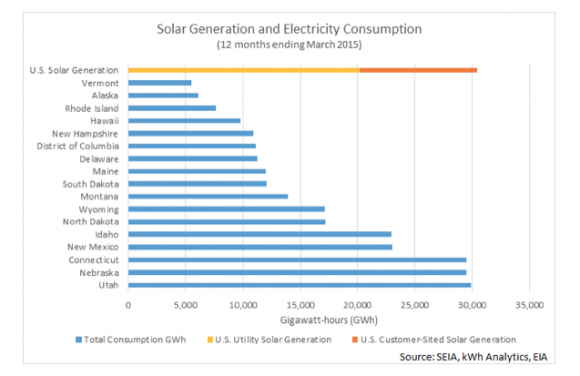
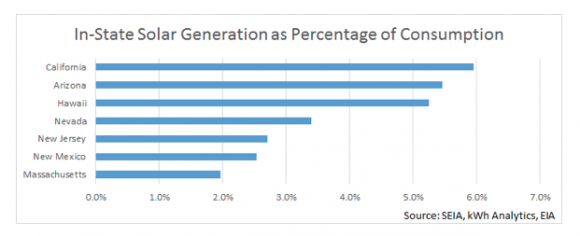
All told, analysts found that solar energy systems in the U.S. generated 30.4 million megawatt-hours (MWh) of electricity in the 12 months ending in March 2015. Three states - California, Arizona, and Hawaii – can now say that solar provides more than 5% of their total annual electricity demand.
The new estimate includes generation from behind-the-meter solar systems, which is not included in estimates produced by the Energy Information Administration (EIA). The EIA uses solar power generation information collected with their Form 923 survey, which only applies to utility-scale power plants that have more than 1,000 kW in solar generation capacity (i.e. are larger than 1,000 kWac). Given that the average solar PV system that you will find on the rooftops of houses in the U.S. has just 5 kWac of generation capacity, the electricity that they produce is not captured in EIA statistics.
On supporting science journalism
If you're enjoying this article, consider supporting our award-winning journalism by subscribing. By purchasing a subscription you are helping to ensure the future of impactful stories about the discoveries and ideas shaping our world today.
As a result, the EIA estimated that solar power produced 20.2 million MWh of electricity over the 12 months ending in March 2015 compared to the 30.4 million MWh published in the analysis from SEIA and kWh Analytics.
According to Richard Matsui, Chief Executive Officer of kWh Analytics, the fact that their estimates are so much higher than the EIA’s is not surprising and is not an indicator of subterfuge:

Credit: SEIA, kWh Analytics
“It’s an open secret among industry watchers that the EIA has been systematically underestimating energy output from solar. It’s not due to any intentional bias against solar itself; for decades, the EIA only collected data from utility-scale power plants because virtually all power plants were utility-scale. The explosion of distributed, rooftop solar in just a few years has created an enormous data management challenge for the EIA.”

Credit: SEIA, kWh Analytics
As a result of this new analysis, Matsui hopes that he and his colleagues can work with the EIA to improve solar production estimates. They are already planning to regularly publish their findings as a type of index, to help in this endeavor.
“This new, national SEIA-kWh Analytics Solar Generation Index validates the tremendous progress that the American solar industry has made towards making solar a mainstream energy source,” said Matsui. He added that the index “also highlights the need for continued vigilance on the part of the solar industry to ensure that these power plants continue to perform reliably.”
