This article was published in Scientific American’s former blog network and reflects the views of the author, not necessarily those of Scientific American
In general we have difficulty spending money in a balanced way. We spend too much money at the beginning of the month, after we get our paychecks, and end up with too little at the end of the month. We also spend too much money while we are young, so that we have too little left for our old days. Why do we spend our money too soon, and what can we do about it? Before we discuss an experiment that examines this question, let’s first try to explain why balanced spending is so important.
Dimishing Marginal Utility
Let’s compare the spending patterns of two fictional characters, Amie and Bob. Both have $1,200 per month for their daily expenses, and both have similar preferences. The only difference is that they spread their spending differently. Amie spreads out the $1,200 more or less evenly over the entire month: So she spends about $40 per day. In contrast, Bob goes a bit wild at the beginning and spends about $80 per day in the first 10 days of the month. In the remaining 20 days, he spends about $20 per day—which is all he can spend (our fictional characters are not allowed to borrow money and they don’t have a credit card).
On supporting science journalism
If you're enjoying this article, consider supporting our award-winning journalism by subscribing. By purchasing a subscription you are helping to ensure the future of impactful stories about the discoveries and ideas shaping our world today.
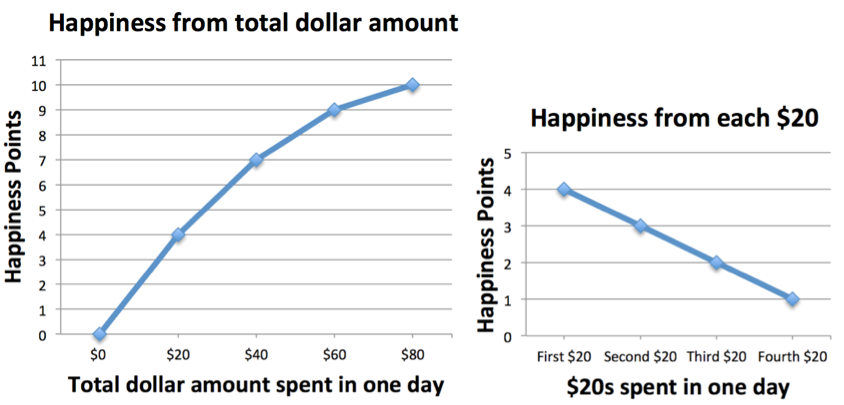
The amount that Amie and Bob spend is the same ($1,200), but who is happier? To look into this question, let’s try to quantify happiness. Rather than saying that someone is “very happy” or “quite happy”, we’ll frame happiness in terms of Happiness Points (economists might say “Utils”). To help us think about Happiness Points, look at the graphs below, and focus on the left one for now. It describes the happiness Amie and Bob derive from spending certain amounts of money in one day.

Remember that Amie and Bob have the same preferences, so the graphs describe both Amie and Bob. Let’s walk through the left graph a bit. If Amie (or Bob) had $0, she would not be happy at all: 0 Happiness Points. If she would have $20, she would buy some basic food, which would give her 4 Happiness Points. If she would have $40, she would also buy some snacks, boosting up her happiness to 7 Happiness Points.
Note that the difference in happiness between $0 and $20 is 4 Happiness Points, but the difference between $40 and $20 is only 3 Happiness Points. It means that the first $20 is worth 4 Happiness Points, but the second $20 is worth only 3 Happiness Points. This type of decreasing sensitivity is also shown in the graph on the right. We depicted happiness this way deliberately, and the principle is very general, and it applies to many aspects of life. The reason is that the basic food Amie (or Bob) would buy with $20 is worth more in terms of happiness than the snacks she would buy with an additional $20. And the same is true for third and fourth $20s, with which she might buy coffees, and go to a bar. These additional things are always worth a little bit less.
In Economics-speak this is called diminishing marginal utility. In our example, marginal utility refers to the happiness derived from each additional $20. That marginal utility diminishes is illustrated by the graph on the right sloping downwards, and the graph on the left curving inwards. It is not just Amie and Bob’s problem: It is a phenomenon so common that many economists call it the law of diminishing marginal utility.
Now let’s compare Amie and Bob’s happiness, given they spread their spending differently. As we said earlier, Amie spreads the $1,200 evenly over the entire month (30 days), which means that she spends $40 per day. This will give her in total 7 Happiness Points per day. In one month, this means she gets 210 Happiness Points.
In contrast, Bob spends a lot in the first 10 days of the month, namely $80 per day. This will give him in total 10 Happiness Points per day. But then he has to cut his spending in the remaining 20 days, in which he can only spend $20 per day. This will give him only 4 Happiness Points per day. So, in one month, Bob gets only 180 Happiness Points. This is 30 Happiness Points less than Amie. That’s almost 15% less happy, although they are spending the same total amount!
|
Amie |
Bob |
|
|
First 10 days |
|
|
|
Remaining 20 days |
|
|
|
Total for one month |
|
|
The point is that the extra third and fourth $20s Bob is spending in the first 10 days of the month are worth less than the second $20s he has to cut in the remaining 20 days of the month. This means that the bit of happiness Bob gains from boosting up his spending to $80 does not outweigh the more substantial loss in happiness due to cutting down his spending to $20 in the remaining days. Conclusion? All things being equal, we should space out our spending, like Amie does.
Present Bias in Spending
Now, are people more like Amie, or like Bob? Do they spread out their spending, or do they spend too much up front? To answer this question, we ran an experiment last October, at the North Carolina State Fair. The Fair is a good place to look for irrational spending in general, and not just when people spend money on Deep-Fried Oreos and the famous Snake Woman.
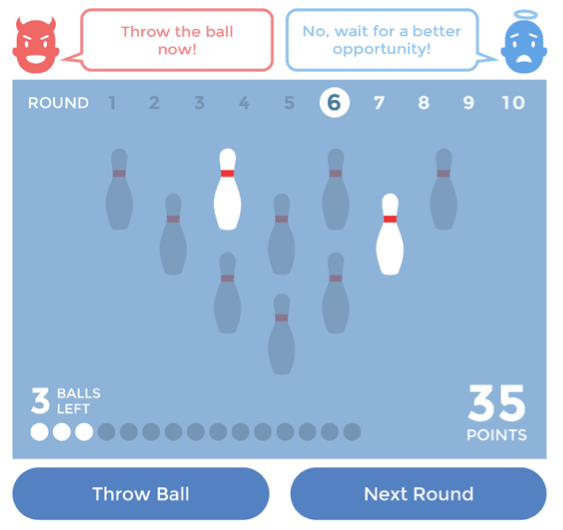
Participants played a very simple bowling game. This game had the essential ingredients to look at spending behavior: a budget, diminishing marginal utility of spending, and a temptation to spend too early. Each participant received 15 balls for 10 rounds of bowling, and they were free to choose how many balls they wanted to throw in which round. The 15 balls were the participant’s “budget”, throwing the balls was like “spending” the budget, and the 10 rounds provided a temptation to spend too early. In each of the 10 rounds, 10 pins were newly lined up. At each moment in the game, the participant could choose to either throw a ball at the (remaining) pins, or to move to the next round and get 10 new pins. For each pin knocked over, the participant had a chance to earn 25 cents. In throwing a ball, there was no skill involved: One ball just knocked over a random number of the remaining pins.

Illustration by Matt Trower
A bad strategy, although tempting, is to keep on throwing balls in one round until the very last pin is hit. The obvious downside of this approach is that, if you throw at say 2 pins, you can only hit 2 pins! It is much better to “save” the ball for later, when there are more pins to hit. In other words, throwing balls in one round has diminishing marginal utility. In one round, the gains from each additional throw become smaller and smaller. A better strategy is to throw one or two balls in a round, and then to move on to the next round and get 10 new pins. The worst is to get 10 new pins in later rounds, but having no balls left to throw at them. So rational players spread their throwing over the different rounds.
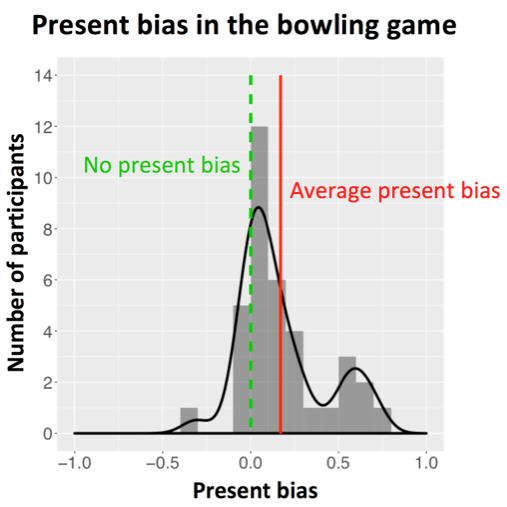
The problem is that people care a lot about the present, and much less about the future. This is a phenomenon called present bias. In our game a present bias means that participants would be tempted to keep throwing balls in the round they are in, rather than wait for a more opportune, future, moment. To capture the intensity of this bias, we scored participants on this tendency, with a score that ranged from 1 if they used all their balls in the first round (1 = fully present biased), to 0 if they spread throwing perfectly evenly (0 = no present bias), and to –1 if they threw all their balls in the last round (–1 = fully future biased). And of course, the measure could take on any value between 1 and -1. What did we find?

NOTE: 43 people participated in the experiment, 7 of which were excluded from the analysis because they did not understand the game. Participants played two (identical) bowling games, and had 1 chance in 20 to be paid 25 cents per pin hit in one of the games. We report averages of the two games.
Some participants had little present bias. But the tail of the curve is clearly fatter on the right, where present bias is positive. The average present bias was 0.17 (greater than 0, highly significant, Wilcoxon signed-rank test, p < .0001).
Moreover, present bias made people lose money! Participants who had little present bias (between -0.05 and 0.05) did well and hit 65 pins on average. But if you look at all participants, they hit on average only 59 pins (less than 65, highly significant, Wilcoxon signed-rank test, p < .01), almost 10% less. In money terms, the difference is one dollar and 50 cents. Note that our State Fair sample was mostly low-income. So the substantial amount of present bias is quite striking. Moreover, the game lasted only a few minutes, so the future in the game was really not very far from the present.
Towards More Balanced Spending
In line with our casual day-to-day observations, it seems that we are bad at spending in a balanced way, and that the present bias makes us spend too early. What we learnt from the bowling game is that people fail to balance spending even in a simple game that lasts only a few minutes. Extrapolating from this game suggests that we spend too much when we are young, and have too little left when we are old. That we spend too much at the beginning of the month, and have too little left for the end of the month.
What can we do about this damaging tendency? How can we do better in terms of spreading our spending? It seems that this is another area where, left to our own accord, we are likely to make mistakes, and we need some help. Maybe we need a debit card that will defrost only a small amount of money for our daily spending every day. We might still spend too much on breakfast, but at least we will still have money for food at the end of the month! Or maybe we need a different budgeting approach that more clearly shows us the tradeoffs we are making between now and later. What about an alert from our bank that will warn us when we get close to overspending at the beginning of the month. Whatever the approach is, it is clear to us that this is an area where we need help to overcome our present bias – because the consequences of letting the present bias run wild are just too substantial.
Special thanks to Lin Xiao, Ting Jiang, and Kristen Berman for their invaluable help, to Matt Trower for the awesome illustration, and to MetLife Foundation for generously funding this research. The Foundation aspires to help people build a better tomorrow through access to the right financial tools and services.