This article was published in Scientific American’s former blog network and reflects the views of the author, not necessarily those of Scientific American
A recent study using NASA’s CALIPSO satellite described how wind and weather carry millions of tons of dust from the Sahara desert to the Amazon basin each year – bringing much-needed fertilizers like phosphorus to the Amazon’s depleted soils.
To bring this story to life, NASA Goddard’s Scientific Visualization team produced a video showing the path of the Saharan dust, which has been viewed half a million times. This story is notable because it relies on satellite technology and data to show how one ecosystem’s health is deeply interconnected with another ecosystem on the other side of the world.
Stunning data visualization like this one can go a long way to helping communicate scientific wonders to the wider world. But even more important than the technology driving the collection and analysis of this data is how the team presented its findings to the public – as a story. NASA’s CALIPSO data offers a model of how scientists, technologists and journalists can come together and make use of data to help us respond to this a slow-motion crisis like air pollution.
On supporting science journalism
If you're enjoying this article, consider supporting our award-winning journalism by subscribing. By purchasing a subscription you are helping to ensure the future of impactful stories about the discoveries and ideas shaping our world today.
Being able to see the dust blowing in the wind has broad implications. Today, one in eight people in the world dies from exposure to air pollution, which includes dust. This stunning fact, issued by the World Health Organization last March, adds up to 7 million premature deaths per year. Air pollution is now the single largest environmental risk in the world, and it occurs both indoors and outdoors.
The WHO report, which more than doubles previous estimates, is based on improved exposure measurements including data collected from satellites, sensors and weather and air flow information. The information has been cross-tabulated with demographic information to reveal, for example, that if you are a low- to middle-income person living in China, your chances of dying an air pollution-related death skyrockets.
These shocking statistics are hardly news for people living in highly polluted areas, though in many of the most severely affected regions, governments are not eager to confirm the obvious. The availability of global scale particulate matter (dust) monitoring could change this dynamic in a way that we all can see.

DustDuino can help individuals with limited resources monitor PM10 and PM2.5 concentrations, indoors or outdoors. (Source: Public Lab)
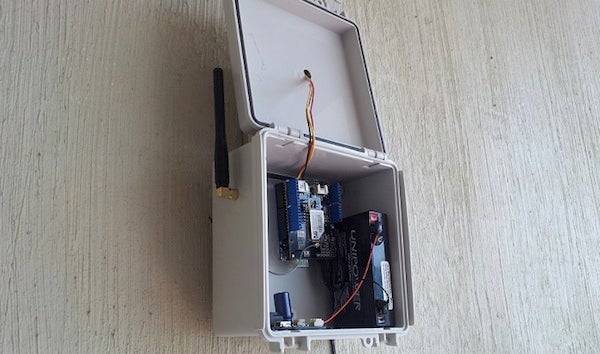
In addition to the volume of satellite data generated by NASA, sensor technology that helps create personal pollution monitors is increasingly affordable and accessible. Projects like the Air Quality Egg, Speck and the DustDuino (with which I collaborate) are working to put tools to collect data from the ground in as many hands as possible. These low-cost devices are creating opportunities for citizen science to fill coverage gaps and testing this potential is a key part of our upcoming installation of DustDuino units in Sao Paulo, Brazil later this summer. Satellite data tend to paint in broad global strokes, but it’s often local details that inform and motivate decisions.
Satellites give us a global perspective. The official monitoring infrastructure, overseen by large institutions and governments, can measure ambient air at a very high resolution and modeling exposure over a large area. But they don’t see everything. The nascent field of sensor journalism helps citizen scientists and journalists fill in the gaps in monitoring networks, identifying human exposures and hot spots that are invisible to official infrastructure.

A DustDuino sensor installed in São Paulo, Brazil (Photo courtesy of Willie Shubert)
As program officer of the Earth Journalism Network, I help give training and support to teams of data scientists, developers and environmental journalists around the world to incorporate this flood of new information and boost local environmental coverage. We have taken this approach because the skills that we need to communicate about slow-motion crises like air pollution and climate change require a combination of experts who can make sense of data and journalists who can prioritize and contextualize it for their readers.
Leveraging technologies, skills and expertise from satellites, sensors and communities alike, journalists, scientists and technologists need to work together to translate data into the knowledge needed to address environmental crises.